Blogs
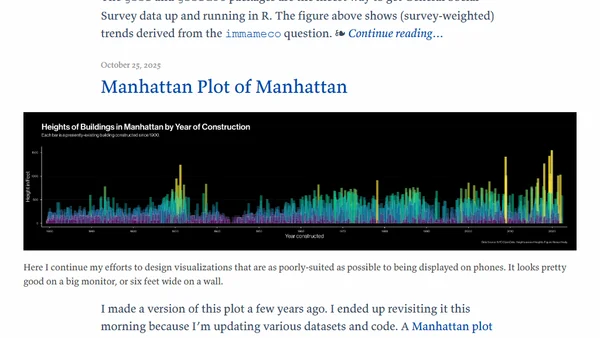
A blog covering data visualization, spatial analysis in R, election mapping, and social science data, with a focus on technical methods and tools.
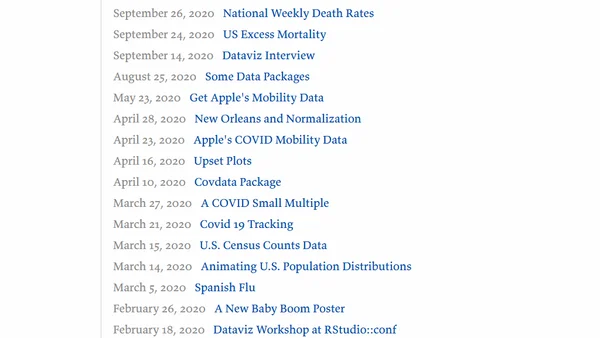
A blog archive listing posts about data visualization, statistical analysis, and data science using the R programming language.
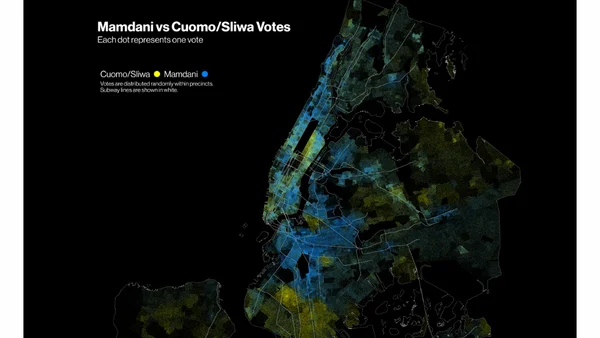
A technical analysis of NYC mayoral election results using R, spatial data, and GIS techniques to create maps visualizing precinct-level voting patterns.
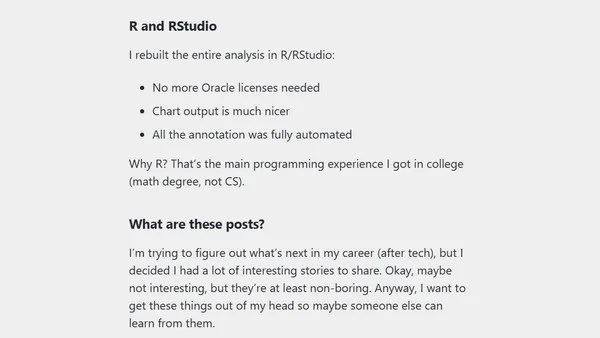
A developer saves their company $4,500/month by replacing an expensive Oracle tool with a free R script for data analysis and visualization.
The author discusses updates to gssrdoc, an R package that provides integrated help documentation for the General Social Survey (GSS) dataset.
A technical guide on using the {gt} package to format and fix tables in Typst PDF documents, aimed at R users.
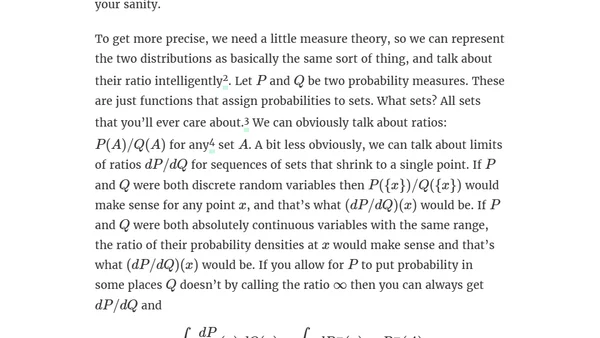
Explains why AIC comparisons between discrete and continuous statistical models are invalid, using examples with binomial and Normal distributions.
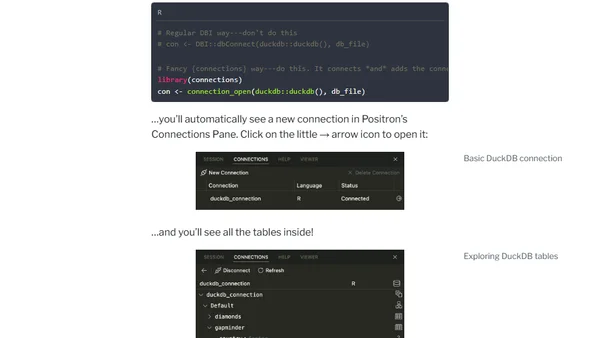
A tutorial on using Positron's Connections Pane to connect to and query DuckDB databases efficiently, especially for handling large datasets.
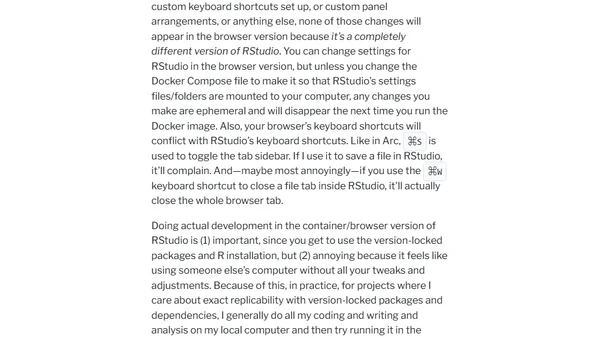
A guide on using Positron IDE to SSH into local Docker containers for running R code, improving reproducibility and environment management.
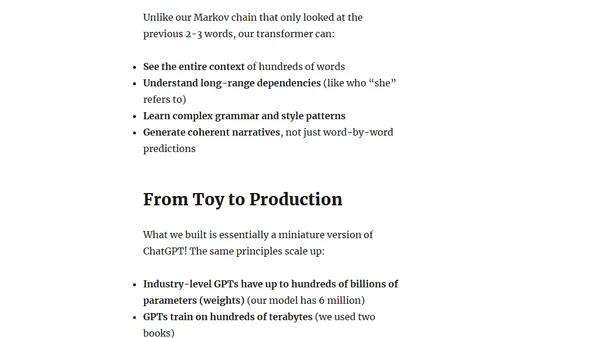
A tutorial on building a transformer-based language model in R from scratch, covering tokenization, self-attention, and text generation.
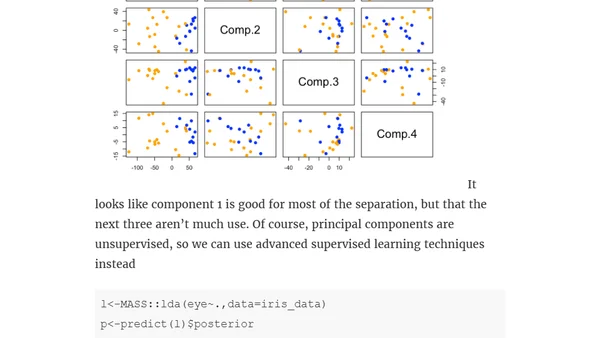
A technical analysis using R to classify iris images from a dataset, applying PCA and LDA for machine learning classification.
Introducing the {RKaggle} R package for downloading Kaggle datasets directly into the R console, covering installation and basic usage.
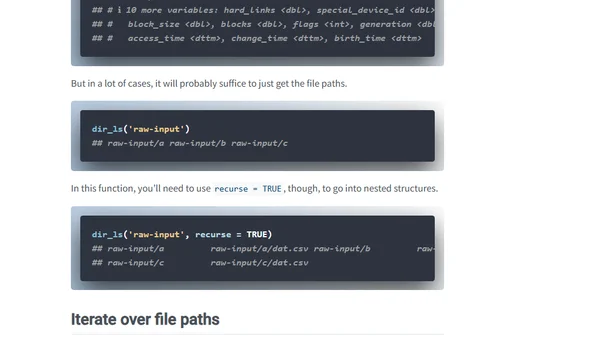
A tutorial on using the {fs} package in R for easier file path manipulation, extension management, and directory information retrieval.
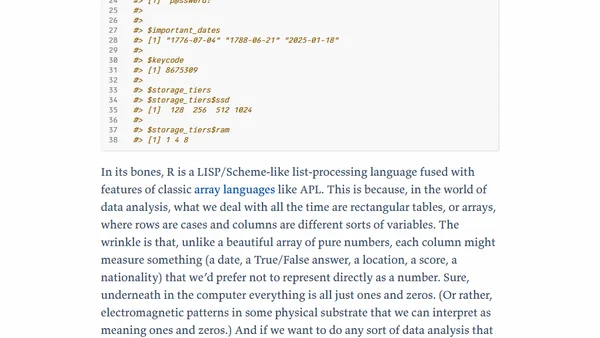
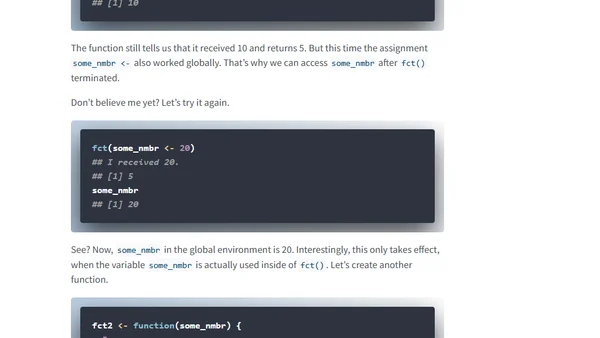
Explains the key differences between the = and <- assignment operators in the R programming language, focusing on scoping and side effects.
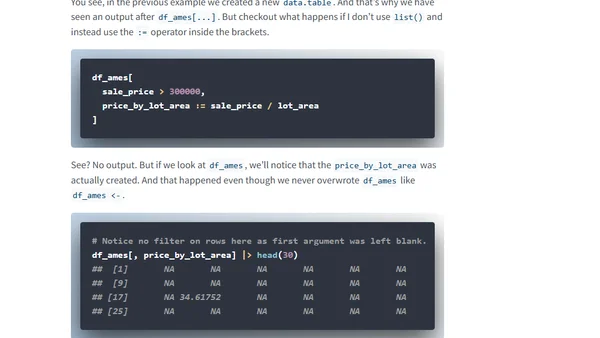
A technical comparison of data.table and dplyr for data cleaning operations in the R programming language.
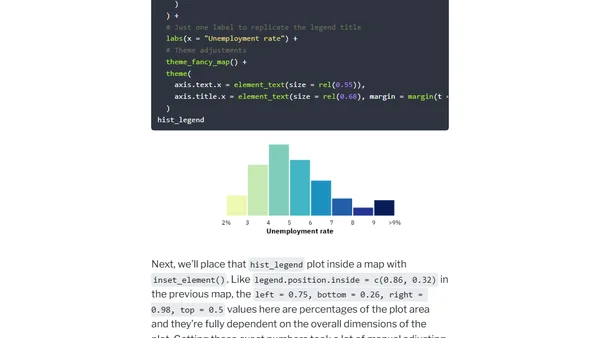
A tutorial on creating a choropleth map with a histogram legend in R using ggplot2, sf, and patchwork to better visualize data distribution.
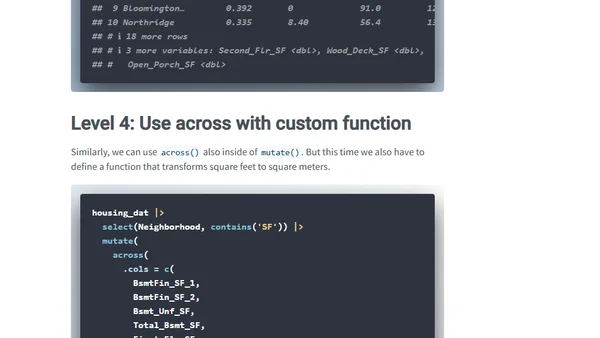
A tutorial for R users on mastering data wrangling in 5 progressive levels, using the dplyr package and the Ames housing dataset.
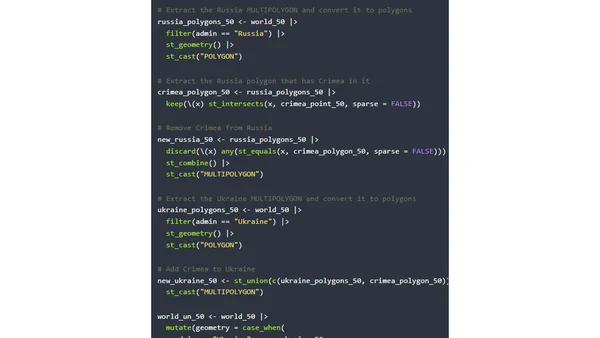
A technical tutorial on using R and the sf package to adjust map boundaries, specifically addressing the Crimea region's political representation in geographic data.
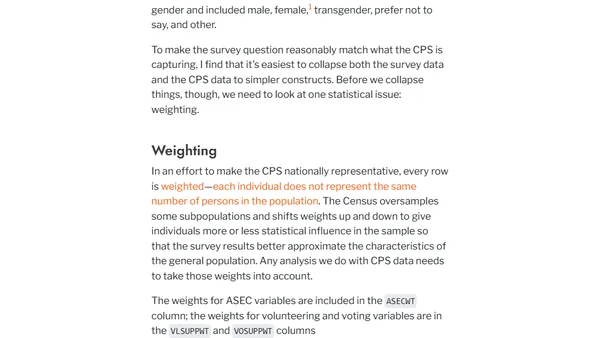
A guide to comparing survey sample demographics with national population data using R, covering both classical and Bayesian statistical methods.
A tutorial on using the R package {blastula} to create and send automated emails with dynamic content and HTML formatting.