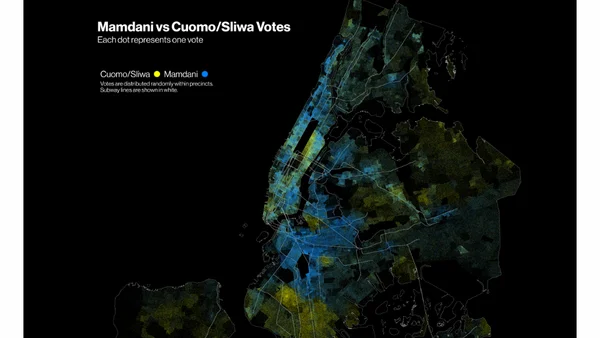
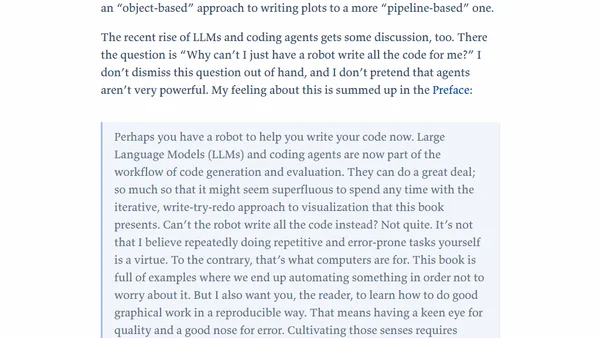
Under the hood of Canada Spends with Brendan Samek
An interview about Canada Spends, a project using Datasette, SQLite, and LLMs to make Canadian government financial data accessible and explorable.
Learn to build personal data dashboards using Python Shiny, demonstrated through a classical guitar practice tracking example.
A guide to integrating Apache ECharts into a React application for data visualization, including a custom wrapper component.
A developer discusses designing an inclusive SaaS dashboard, focusing on color blindness accessibility and user experience principles.
A humorous analysis exploring the correlation between the number of metal bands per capita and national happiness scores in European countries.
A developer shares insights and lessons learned from speaking at tech conferences, including idea generation and personal experiences.
A personal request for help finding a short-term sublet in NYC after a last-minute cancellation.
A guide on how to extract your personal run data from the Nike Run Club app using a bash script and visualize it with Python.
An analysis of user-created Sankey diagrams from Reddit, visualizing personal Tinder match data and dating outcomes.
Analysis of PHP's limitations for machine learning, focusing on visualization, Jupyter support, and GPU capabilities compared to Python.
An introduction to graph theory using examples from Facebook, Game of Thrones, and social relationships to explain network concepts.
A personal selection of the author's favorite conference talks from 2017, covering web development, data visualization, and browser technology.
A guide for academics with math/physics backgrounds transitioning into data science, covering skills, learning paths, and practical advice.
A summary of a D3.js data visualization workshop for gifted high-school students, covering materials and projects.
A former PhD scientist shares his positive transition to data science freelancing, detailing the freedom and variety of his new career.
A summary of the second Nilearn sprint, highlighting new features and improvements for this neuroimaging machine learning library.
A tutorial on creating reusable D3.js chart components within Angular directives, demonstrating composition with a line chart and scatter plot.
A step-by-step tutorial for creating a basic area chart using the D3.js JavaScript library, focusing on simplicity and core concepts.
A tutorial on creating interactive Small Multiples line charts with D3.js and Angular.js, including brushing for synchronized views.
A Python tutorial showing how to download your Twitter timeline and visualize it as a word cloud using data science libraries.