How to use a histogram as a legend in {ggplot2}
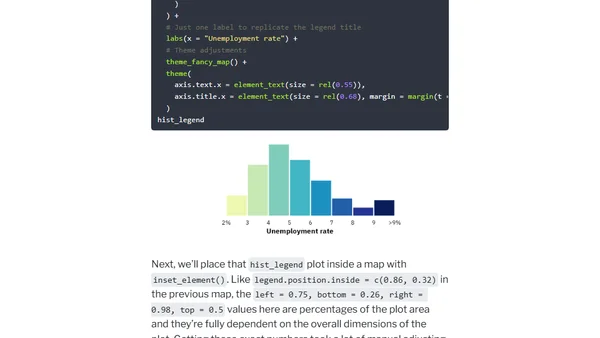
Read OriginalThis technical tutorial demonstrates how to programmatically create a choropleth map with an integrated histogram legend using R, ggplot2, the sf package for spatial data, and patchwork for layout. It addresses the visual distortion in maps caused by varying geographic unit sizes and shows how a histogram legend provides clearer context for data distribution, such as unemployment rates.
0 comments
Comments
No comments yet
Be the first to share your thoughts!
Browser Extension
Get instant access to AllDevBlogs from your browser
Top of the Week
No top articles yet