Mamdani vs Sliwa and Cuomo
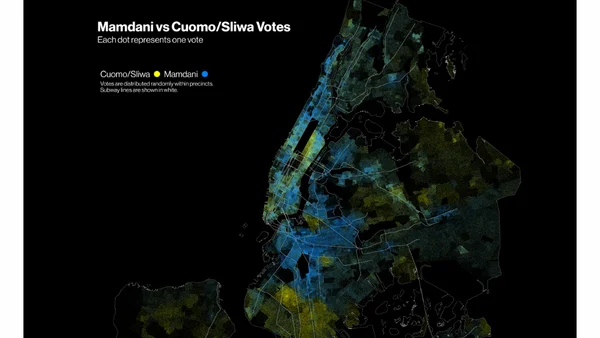
Read OriginalThe article details a data science project analyzing New York City mayoral election results. It explains using R, the sf package, and spatial data (precinct results, borough maps, MTA GTFS data) to create choropleth and dot-density maps visualizing the Mamdani vs. Sliwa/Cuomo vote share. It discusses technical challenges of spatial representation, color scales, and the benefits of R for data manipulation in this context.
0 comments
Comments
No comments yet
Be the first to share your thoughts!
Browser Extension
Get instant access to AllDevBlogs from your browser
Top of the Week
1
Limit token usage in Microsoft Agent Framework
Jesse Liberty
•
1 votes
2
How to Roll Back AI Agents: Incident Response, Circuit Breakers, and Recovery Patterns
Paul Bryant
•
1 votes
3
Avoiding Reasoning Model Failures with Microsoft Foundry
Luke Murray
•
1 votes
4
When Your AI Agent Lies: Silent LLM Fallbacks
Luke Murray
•
1 votes
5
Adding a custom MCP server to Claude and ChatGPT
Simon Willison
•
1 votes
6
Testing AI prompts and comparing models with promptfoo
Tim Deschryver
•
1 votes
7
Superlogical
Mitchell Hashimoto
•
1 votes