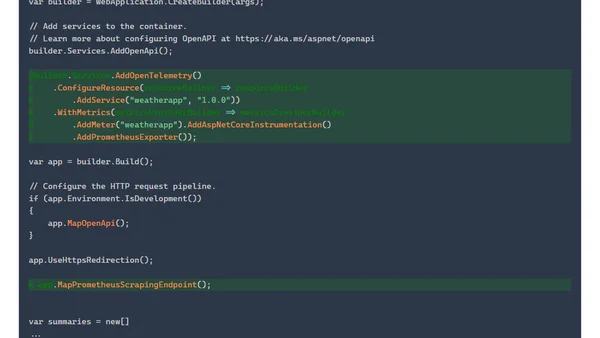
Measures as ends
A critique of using AI to automate science, arguing that metrics have become goals, distorting scientific progress.
Martin Fowler's foreword for 'Frictionless', a book on improving software developer productivity by focusing on feedback loops, flow state, and cognitive load.
A tutorial on instrumenting a .NET Web API with OpenTelemetry Metrics, collecting them with Prometheus, and visualizing them in Grafana.
An engineer critiques the misapplication of OKRs in tech teams, arguing for simple, outcome-focused plans over rigid quarterly rituals.
A developer troubleshoots missing metrics in a .NET app using OpenTelemetry, finding a breaking change in the Collector.
Explains the SPACE meta-framework for measuring developer productivity across Satisfaction, Performance, Activity, Communication, and Efficiency dimensions.
The article argues for versioning observability concepts, distinguishing between traditional 'three pillars' (1.0) and modern event-based (2.0) approaches.
A guide to setting clear metrics and measurement strategies before implementing web performance optimizations to ensure measurable impact.
Explores how to enable OpenTelemetry observability in Wolverine, highlighting its built-in tracing and metrics capabilities.
Tips for writing effective CVs for tech roles, focusing on quantifying achievements and keeping a work diary to track accomplishments.
A critique of traditional metrics for observability, arguing they are limited for debugging unknown issues but still valuable for system health monitoring.
Explains the difference between .update() and .forward() in TorchMetrics, a PyTorch library for tracking model performance during training.
Explains the difference between .update() and .forward() methods in the TorchMetrics library for evaluating PyTorch models.
Explains why Prometheus is fundamentally a monitoring system, not just a time-series database, and clarifies its design and query behavior.
A guide to learning PromQL by setting up a controlled Prometheus playground environment to test queries and understand core concepts.
A cheat sheet covering fundamental Prometheus concepts including metrics, labels, time series, and the scraping process.
A technical guide on setting up Prometheus and Grafana to monitor a ClickHouse database server, including installation and configuration steps.
A visual guide to understanding PromQL vector matching rules in Prometheus, covering one-to-one, one-to-many, and many-to-one operations.
Explores the need for and methods of correlating different observability signals like metrics, logs, and traces for effective system monitoring.
TinyPilot's monthly update covers revenue decline, hiring efforts, affiliate program challenges, and optimizing order fulfillment processes.