Observability: Metrics in the .NET Ecosystem
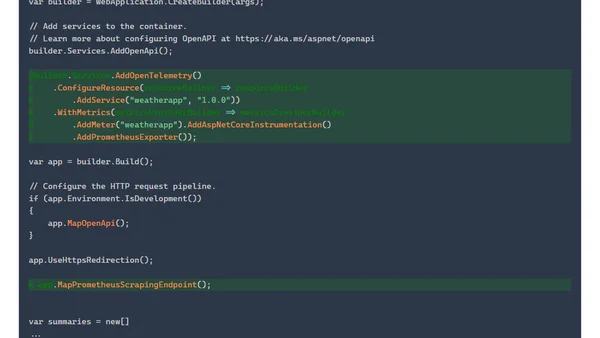
A tutorial on instrumenting a .NET Web API with OpenTelemetry Metrics, collecting them with Prometheus, and visualizing them in Grafana.
Part 3 of a tutorial on implementing Azure Managed Prometheus & Grafana for AKS monitoring using Terraform, focusing on ingress-nginx metrics.
Part 2 of a tutorial on using Terraform to configure Azure Managed Prometheus and Grafana for monitoring an AKS cluster.
A technical guide on setting up Azure Managed Prometheus and Grafana for AKS monitoring using Terraform, part 1 of a series.
A tutorial on setting up a comprehensive Kubernetes monitoring stack using Prometheus, Grafana, and the Robusta platform.
A developer's monthly digest covering books on Go, TypeScript, and Prometheus, plus articles on AI, work culture, and teaching observability.
Part 4 of a Kubernetes for Developers series, focusing on setting up monitoring with kube-prometheus-stack, Prometheus, and Grafana.
Explores the challenges of using Prometheus for ML pipeline monitoring, highlighting terminology issues and technical inadequacies.
Explains why Prometheus is fundamentally a monitoring system, not just a time-series database, and clarifies its design and query behavior.
A guide to learning PromQL by setting up a controlled Prometheus playground environment to test queries and understand core concepts.
A cheat sheet covering fundamental Prometheus concepts including metrics, labels, time series, and the scraping process.
A technical guide on setting up Prometheus and Grafana to monitor a ClickHouse database server, including installation and configuration steps.
A guide to visualizing network latency using ping_exporter, Prometheus, and Grafana for monitoring internet and device health.
A guide to Prometheus's aggregation functions like avg_over_time and sum_over_time for analyzing time series data, with pseudocode examples.
A visual guide to understanding PromQL vector matching rules in Prometheus, covering one-to-one, one-to-many, and many-to-one operations.
A technical guide on configuring Kubernetes Horizontal Pod Autoscalers to scale applications using custom metrics from Prometheus.
A guide to setting up Prometheus and Grafana to monitor system, GPU, and Dask metrics for RAPIDS workloads.
A technical guide on configuring AlertManager to send email notifications via Gmail for alerts from Argo Workflows.
A technical guide on creating a Prometheus alert rule to monitor and alert on failed Argo Workflows in a Kubernetes environment.
A technical guide on configuring Argo workflows to expose Prometheus metrics within a local Kubernetes cluster created using kind.