Presentations: How I Made Immer Twice as Fast: Performance Optimization in Practice
A talk on performance optimization concepts, tools, and techniques using the Immer library as a practical example.

A talk on performance optimization concepts, tools, and techniques using the Immer library as a practical example.
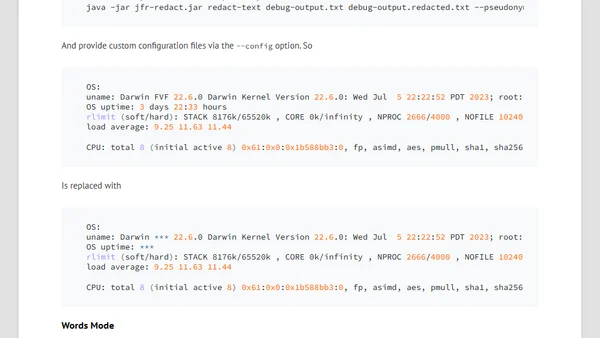
A guide to building a tool for redacting sensitive data like tokens and keys from Java Flight Recorder (JFR) and error log files.
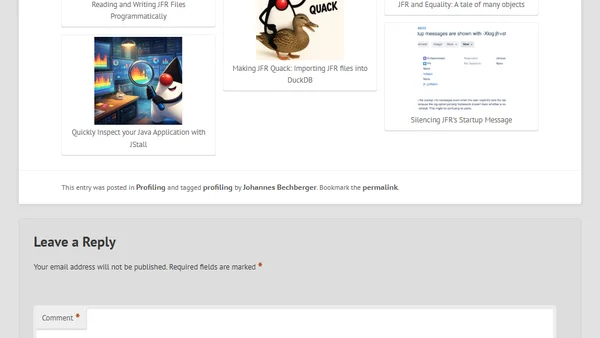
A developer walks through implementing a new JVM analysis feature for the JStall tool, using GitHub Copilot and sharing the development process.
A practical talk on .NET application performance optimization, covering monitoring, profiling, and iterative improvement using tools like dotTrace and BenchmarkDotNet.
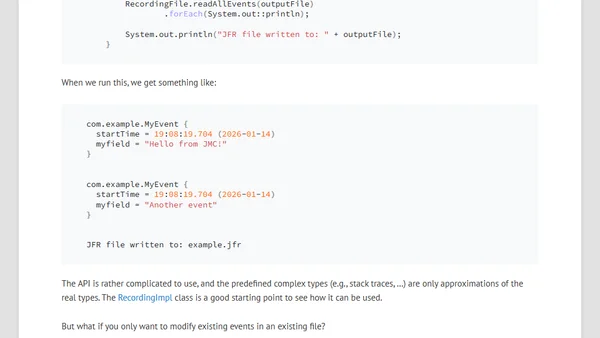
A guide to programmatically reading and writing Java Flight Recorder (JFR) files, comparing built-in APIs and third-party libraries.
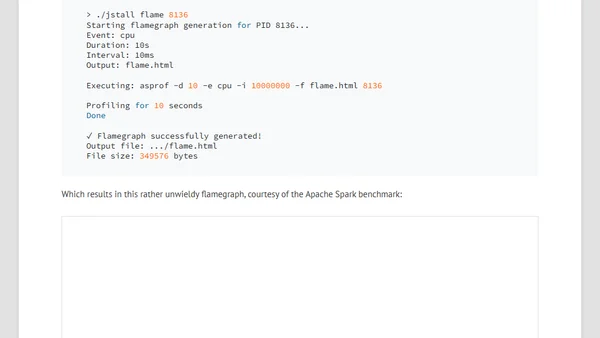
Introduces JStall, a command-line tool for inspecting Java applications via thread dumps and profiling to identify CPU-intensive threads and deadlocks.
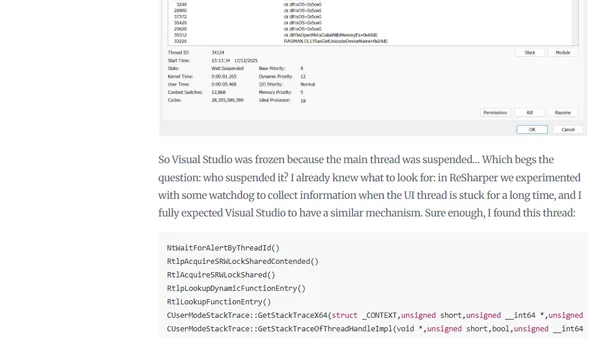
A developer investigates a Visual Studio deadlock using profiling tools and memory dumps, revealing an unexpected thread suspension issue.
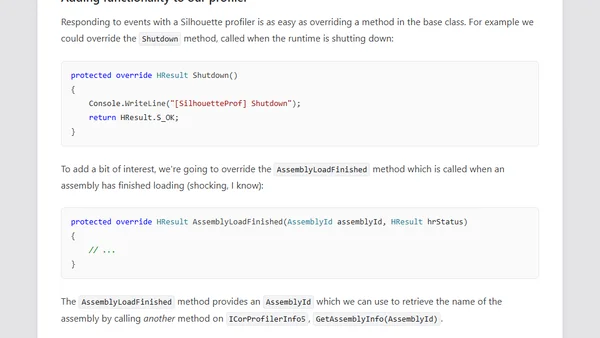
A tutorial on building a basic .NET CLR profiler using the Silhouette library and NativeAOT to log assembly loads.

A critique of the 'pillars of observability' as a marketing term, arguing for a focus on technical 'signals' like traces, metrics, and logs instead.
A guide on importing Java Flight Recorder (JFR) profiling data into DuckDB for analysis using SQL queries.
Explores the intricacies of comparing Java Flight Recorder (JFR) event objects, highlighting unexpected challenges in object equality.
A guide on using the pyinstrument profiler to identify and analyze performance bottlenecks in Air applications built with FastAPI.
A guide to profiling Java applications on Cloud Foundry using the cf CLI Java plugin for heap and thread dumps.
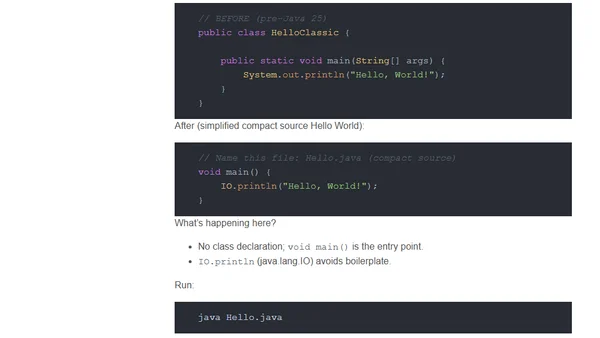
A hands-on tour of Java 25's new features for developers, including language upgrades, concurrency tools, and performance improvements.
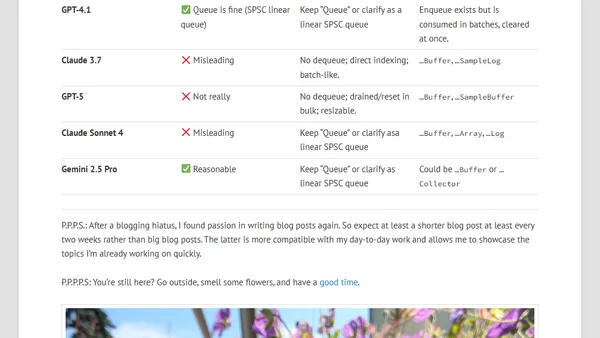
A technical analysis of Java 25's CPU-Time Profiler, focusing on the sampler queue's semantics and synchronization implementation.
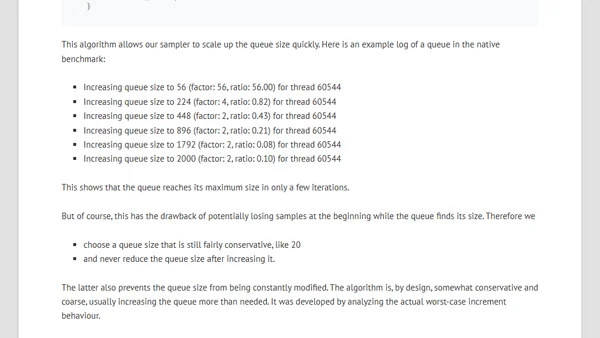
Deep dive into sizing the central request queue for Java 25's new CPU-time profiler, balancing performance and memory usage.
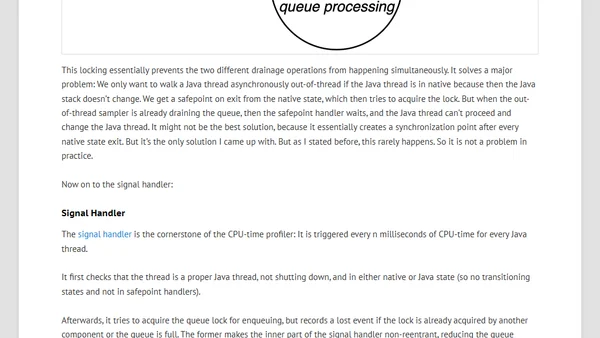
A deep dive into the implementation details of the new CPU-time profiler introduced in Java Development Kit (JDK) 25.
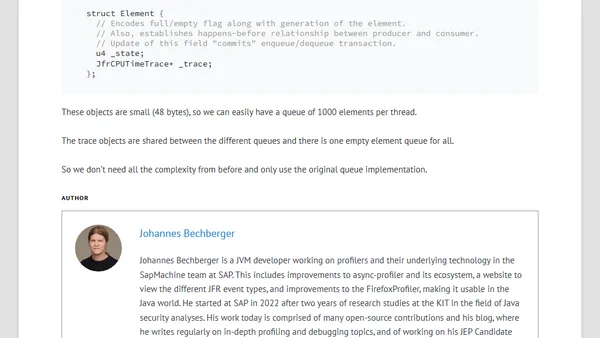
A developer's raw notes on profiling challenges and ideas for JFR stack sampling in the OpenJDK, written in March 2025.
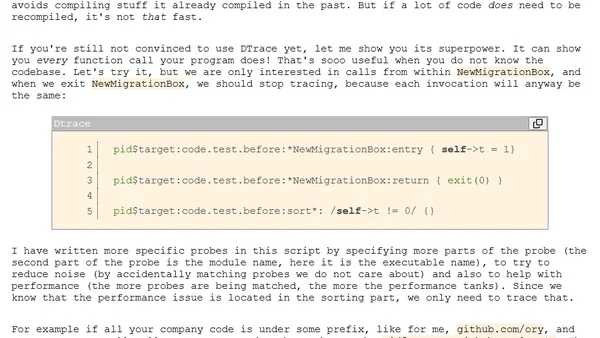
A developer shares a detailed debugging journey using Go profiling and DTrace to uncover and fix a performance bottleneck in a test suite.
Introduction to Java 25's new experimental CPU-time profiler, explaining its advantages over the current JFR method sampler.