Monitor ClickHouse with Prometheus & Grafana
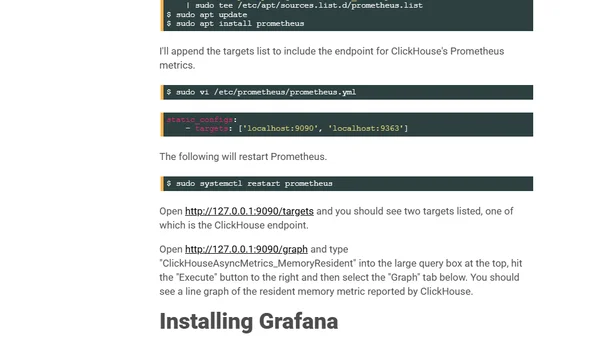
Read OriginalThis article provides a detailed, step-by-step tutorial for monitoring the ClickHouse database using Prometheus for metrics collection and Grafana for visualization. It covers installing ClickHouse, enabling its Prometheus metrics endpoint, installing and configuring Prometheus to scrape those metrics, and includes command-line examples and configuration snippets.
0 comments
Comments
No comments yet
Be the first to share your thoughts!
Browser Extension
Get instant access to AllDevBlogs from your browser
Top of the Week
1
Limit token usage in Microsoft Agent Framework
Jesse Liberty
•
1 votes
2
How to Roll Back AI Agents: Incident Response, Circuit Breakers, and Recovery Patterns
Paul Bryant
•
1 votes
3
Avoiding Reasoning Model Failures with Microsoft Foundry
Luke Murray
•
1 votes
4
When Your AI Agent Lies: Silent LLM Fallbacks
Luke Murray
•
1 votes
5
Adding a custom MCP server to Claude and ChatGPT
Simon Willison
•
1 votes
6
Testing AI prompts and comparing models with promptfoo
Tim Deschryver
•
1 votes
7
Superlogical
Mitchell Hashimoto
•
1 votes