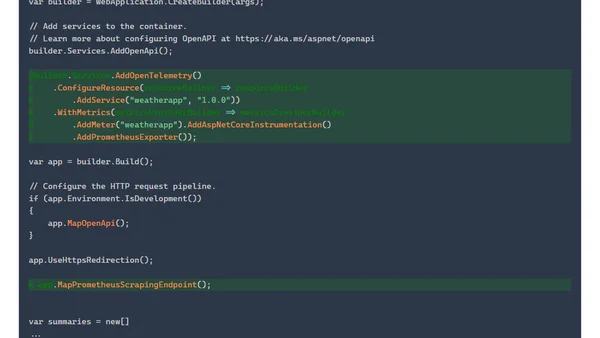
Observability: Metrics in the .NET Ecosystem
A tutorial on instrumenting a .NET Web API with OpenTelemetry Metrics, collecting them with Prometheus, and visualizing them in Grafana.

A tutorial on instrumenting a .NET Web API with OpenTelemetry Metrics, collecting them with Prometheus, and visualizing them in Grafana.
A technical guide on deploying Azure Managed Grafana and using it with VNet Flow Logs and KQL to create network traffic dashboards.
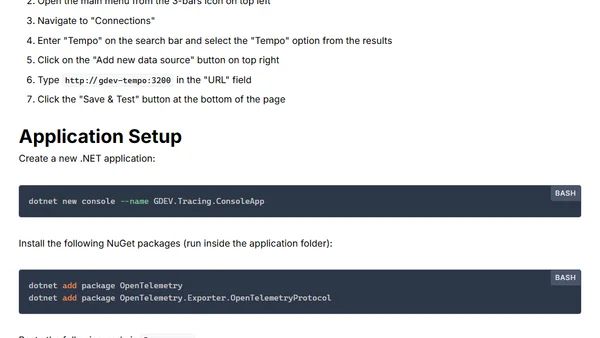
A guide to setting up distributed tracing for C# applications using Grafana and Tempo, including infrastructure configuration and integration.
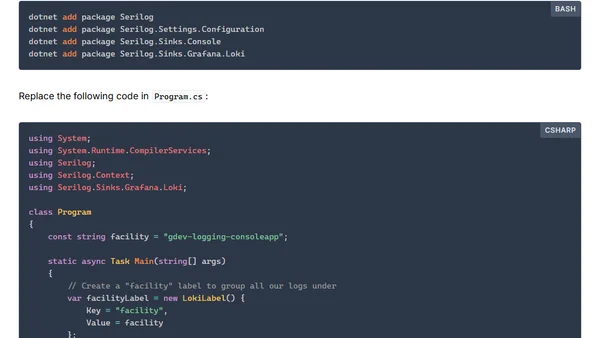
A guide to setting up centralized logging for C# applications using Grafana and Loki, including infrastructure setup and code integration.
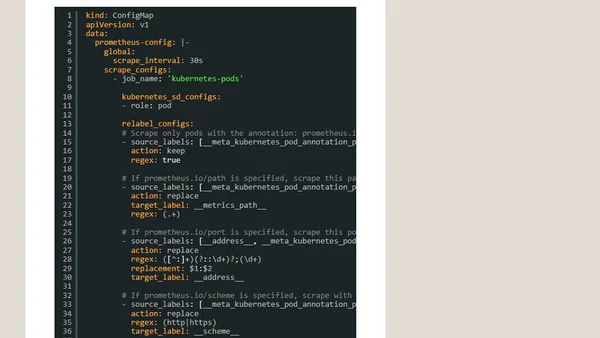
Part 3 of a tutorial on implementing Azure Managed Prometheus & Grafana for AKS monitoring using Terraform, focusing on ingress-nginx metrics.
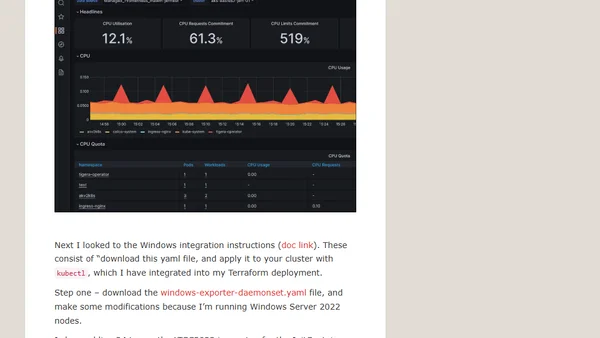
Part 2 of a tutorial on using Terraform to configure Azure Managed Prometheus and Grafana for monitoring an AKS cluster.
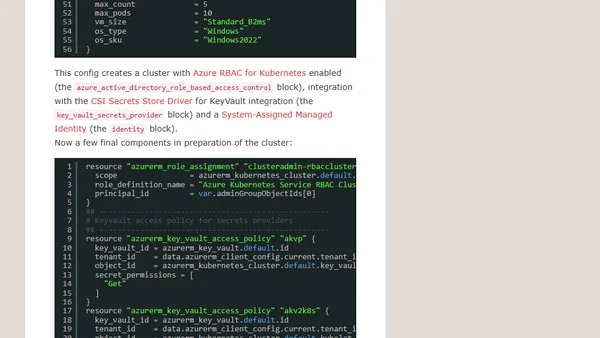
A technical guide on setting up Azure Managed Prometheus and Grafana for AKS monitoring using Terraform, part 1 of a series.
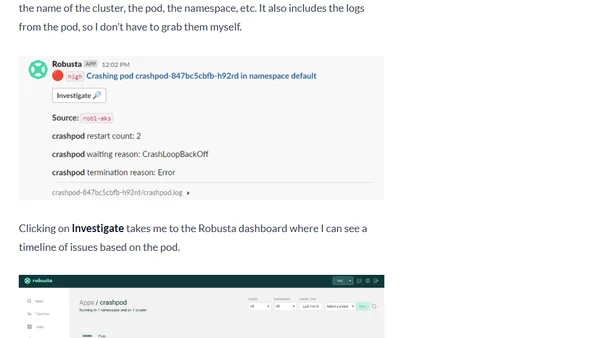
A tutorial on setting up a comprehensive Kubernetes monitoring stack using Prometheus, Grafana, and the Robusta platform.
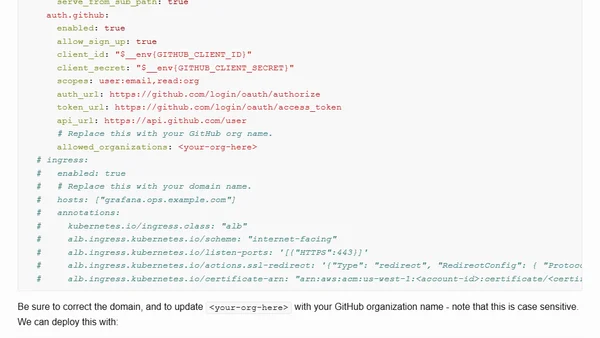
Part 4 of a Kubernetes for Developers series, focusing on setting up monitoring with kube-prometheus-stack, Prometheus, and Grafana.
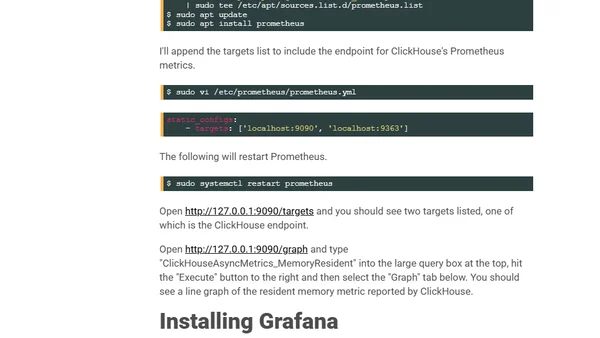
A technical guide on setting up Prometheus and Grafana to monitor a ClickHouse database server, including installation and configuration steps.
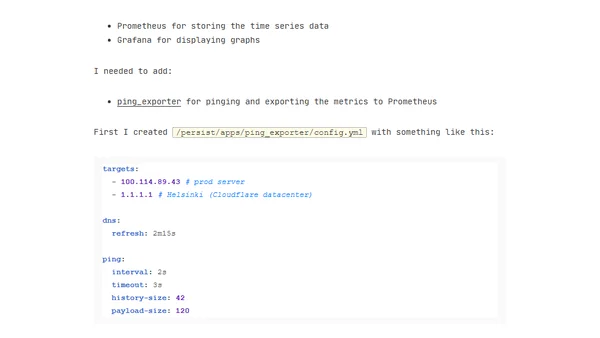
A guide to visualizing network latency using ping_exporter, Prometheus, and Grafana for monitoring internet and device health.
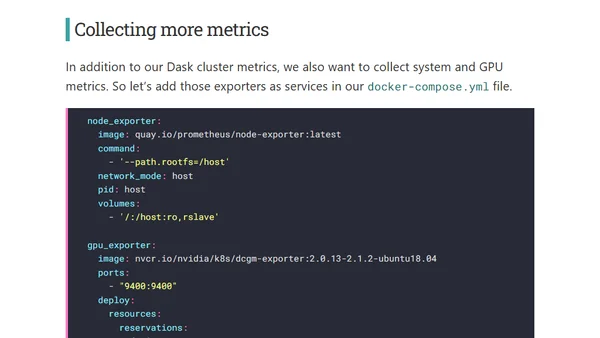
A guide to setting up Prometheus and Grafana to monitor system, GPU, and Dask metrics for RAPIDS workloads.

A technical guide on using Grafana and Kibana for monitoring Azure Arc-enabled SQL Managed Instances, part of a larger series on Azure Arc Data Services.
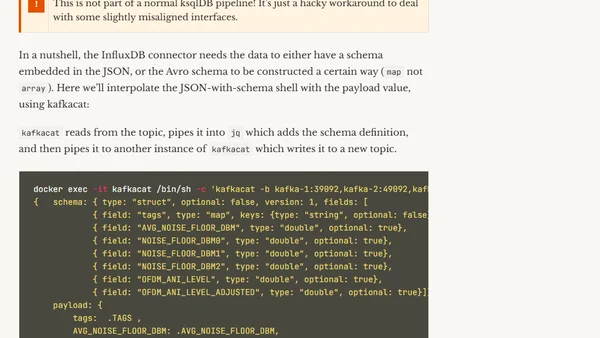
A technical guide to monitoring Sonos device health by streaming diagnostics data through Kafka, ksqlDB, InfluxDB, and visualizing with Grafana.
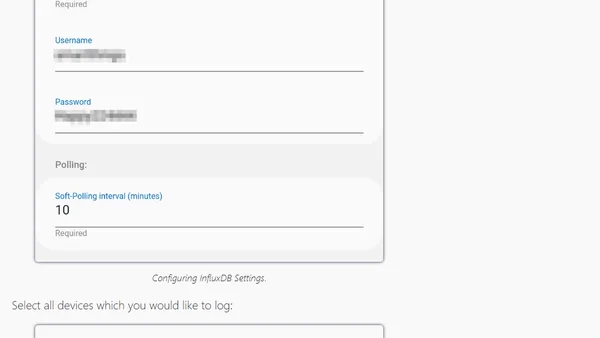
A tutorial on collecting and storing Samsung SmartThings smart home sensor data into InfluxDB on a Raspberry Pi for visualization in Grafana.
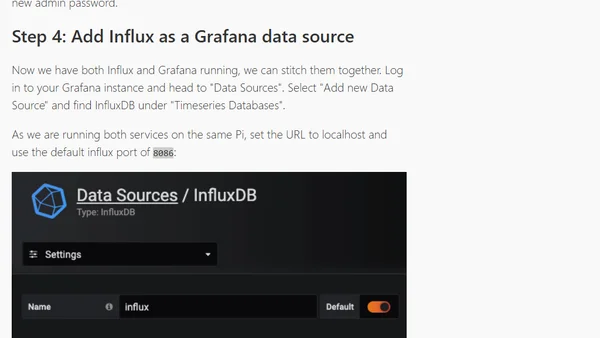
A step-by-step guide to installing InfluxDB and Grafana on a Raspberry Pi for creating a local monitoring dashboard.
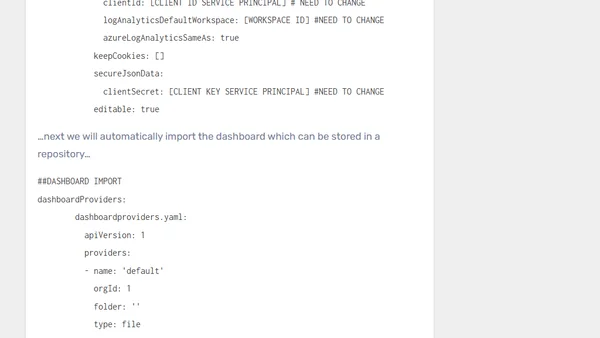
A technical guide on deploying a Grafana dashboard with Azure AD integration for monitoring an Azure Kubernetes Service (AKS) cluster using Helm.

A guide on implementing application monitoring for Spring Boot using Micrometer, Prometheus, and Grafana for internal metrics.
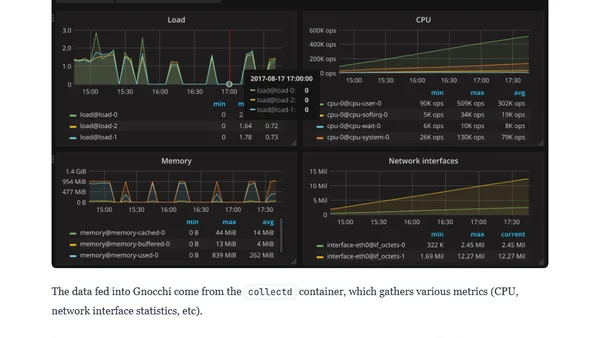
A guide on deploying and using the Gnocchi metrics storage system with Docker, Docker Compose, Grafana, and collectd.
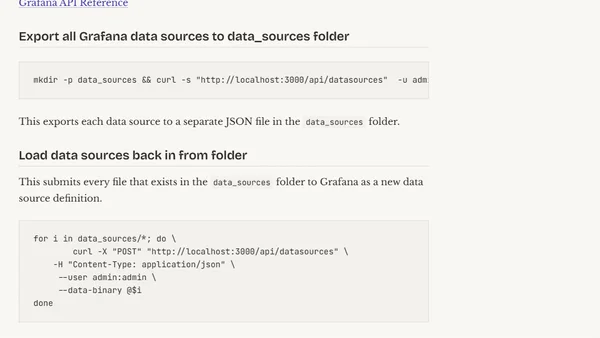
A technical guide for exporting and importing Grafana data sources using curl, jq, and bash scripts.