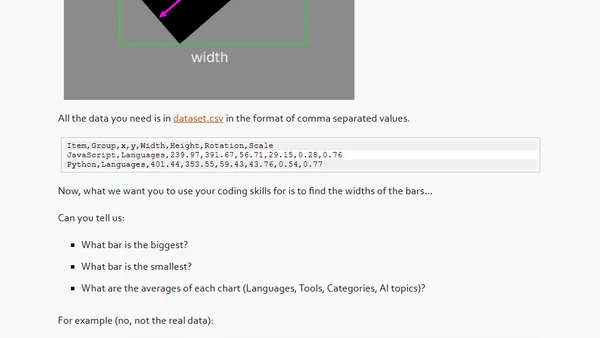
Take the “chart explosion” coding challenge and earn your spot at CODE100 in July in Berlin
Coding challenge to recover exploded bar chart data and earn a spot at CODE100 in Berlin.
A data visualization blog post explaining the creation of a 'Manhattan plot' chart showing building heights in Manhattan over time, with technical details on design choices.
A tutorial on customizing bar chart labels in ggplot2, focusing on placing category labels above bars and styling visualizations.
A tutorial on creating interactive 'You Draw' bar charts using the Compost.js library, inspired by NYT's data visualization style.
A step-by-step tutorial on building a bar chart from scratch using D3.js, covering core concepts like SVG, scales, and margins.
A tutorial on creating bar charts in R using the ggplot2 package, covering the basics of the geom_bar function and data visualization principles.