
Azure Arc enabled Data Services, part 13 – Monitoring with Grafana & Kibana
A technical guide on using Grafana and Kibana for monitoring Azure Arc-enabled SQL Managed Instances, part of a larger series on Azure Arc Data Services.

A technical guide on using Grafana and Kibana for monitoring Azure Arc-enabled SQL Managed Instances, part of a larger series on Azure Arc Data Services.
A guide to implementing and configuring health checks in ASP.NET Core applications, including setting up a dashboard to monitor multiple services.

A guide to using Azure Network Watcher's Connection Monitor tool to track and troubleshoot VM network connections, latency, and availability.

A critique of traditional 'war room' monitoring centers, arguing they are ineffective and harmful compared to automated observability and developer ownership.

A discussion on defining a software team's 'critical path' by focusing on business-critical processes that directly impact revenue and customer experience.
A guide to best practices for monitoring, maintaining, and managing machine learning models and data pipelines in a production environment.
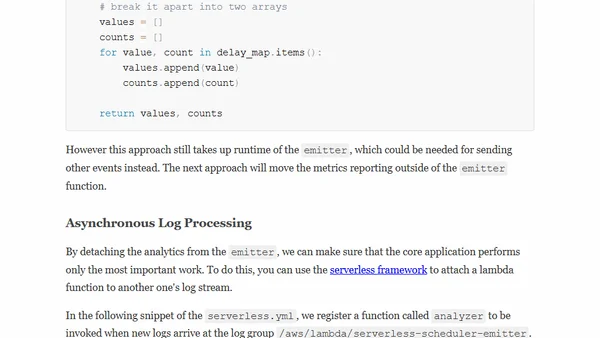
Explains how to monitor serverless scheduler performance using AWS CloudWatch Custom Metrics and Insights, with code examples.
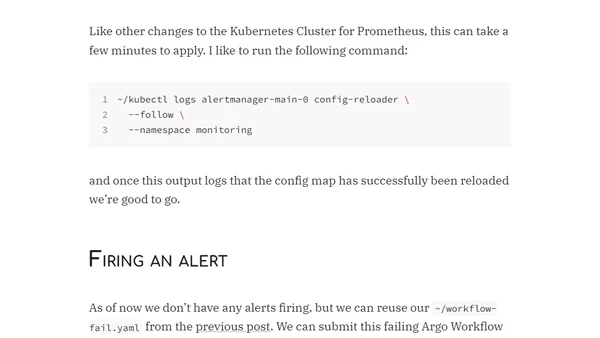
A technical guide on configuring AlertManager to send email notifications via Gmail for alerts from Argo Workflows.
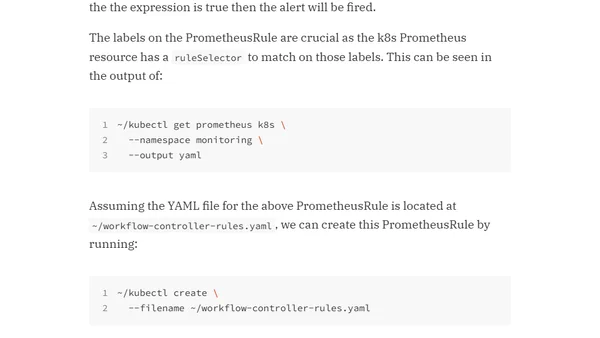
A technical guide on creating a Prometheus alert rule to monitor and alert on failed Argo Workflows in a Kubernetes environment.
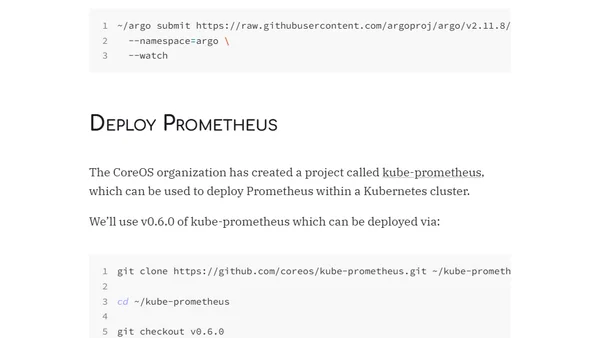
A technical guide on configuring Argo workflows to expose Prometheus metrics within a local Kubernetes cluster created using kind.
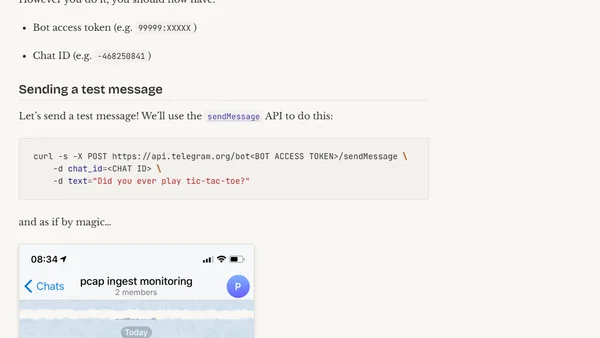
A hacky method to monitor Kafka data arrival using kafkacat and Telegram alerts when message timestamps exceed a threshold.
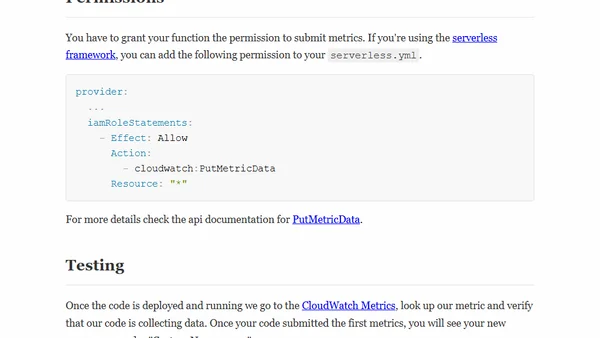
A guide to using AWS CloudWatch Custom Metrics and Alarms to monitor the health of a serverless application's core process.
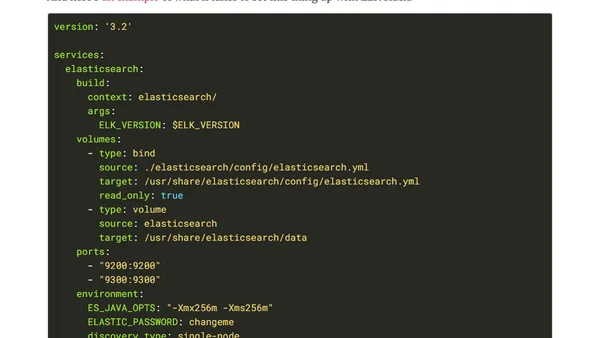
Critiques common logging practices in software development, arguing for alternatives like type safety, error monitoring services, and business metrics.

A critique of how 'observability' is often incorrectly defined as just metrics, logs, and traces, explaining its true meaning from control theory.
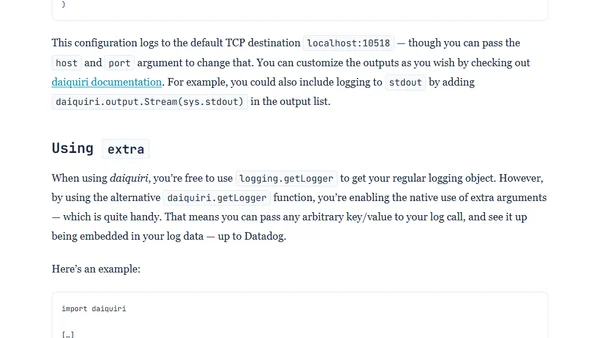
A guide to integrating Python logging with Datadog using the daiquiri library for real-time log indexing and search.
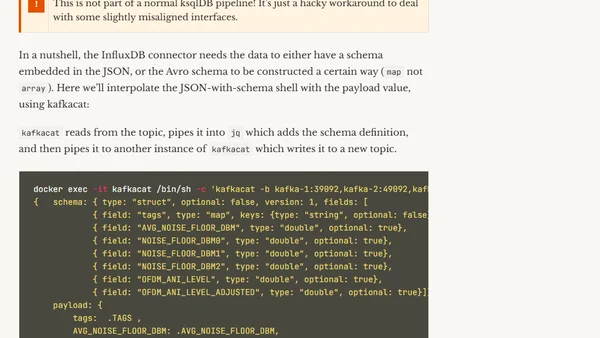
A technical guide to monitoring Sonos device health by streaming diagnostics data through Kafka, ksqlDB, InfluxDB, and visualizing with Grafana.
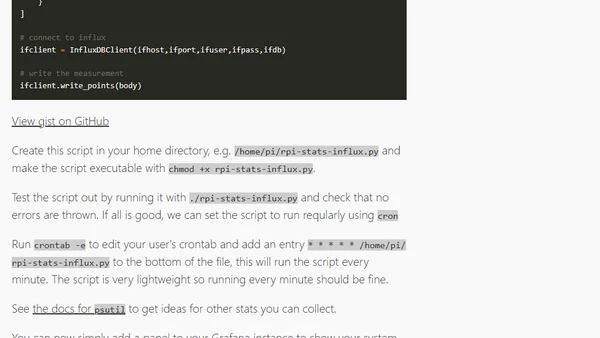
A tutorial on using a Python script to collect Raspberry Pi system metrics and send them to InfluxDB for monitoring with Grafana.
Explores common technical and organizational challenges teams encounter when adopting serverless architecture, including learning curves and new development paradigms.
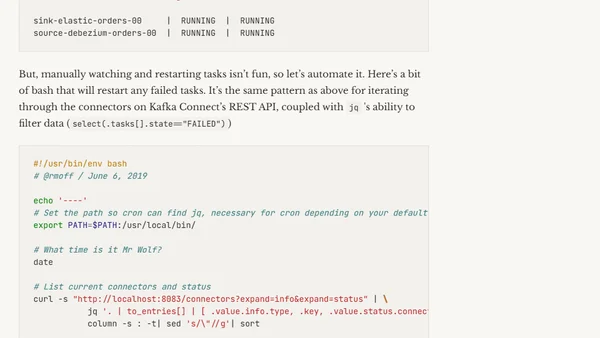
A technical guide on automating the restart of failed Kafka Connect tasks using bash scripts and the REST API.
An analysis of Sysdig's cloud-native monitoring solution, which uses eBPF for container security and performance insights.