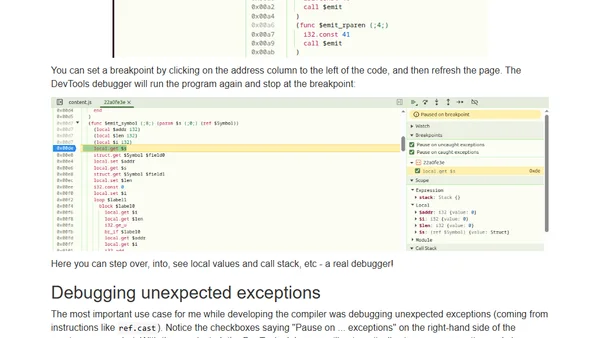
Debugging WASM in Chrome DevTools
Guide to debugging WebAssembly (WASM) code using Chrome DevTools, including breakpoints, stepping, and exception handling.

Guide to debugging WebAssembly (WASM) code using Chrome DevTools, including breakpoints, stepping, and exception handling.
Explains embedded regex flags like (?i) and Python version compatibility issues with global modifiers in regular expressions.
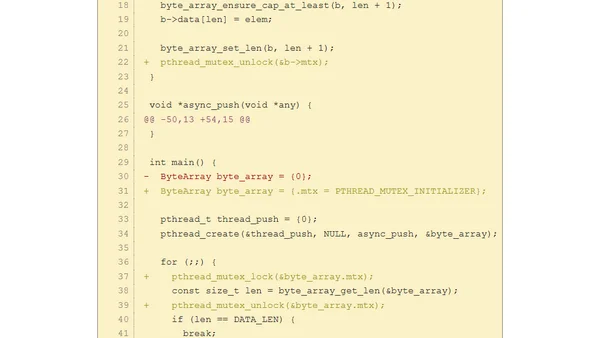
Explains how to use DTrace to detect data races in concurrent programs, with examples in Go and C.

dzDebugVisualizer plugin now supports all Delphi versions from 2005 to 13, adding packages for 14 previously missing versions.
Learn how to use the built-in Trace feature in Azure API Management to debug and troubleshoot API policies step-by-step.
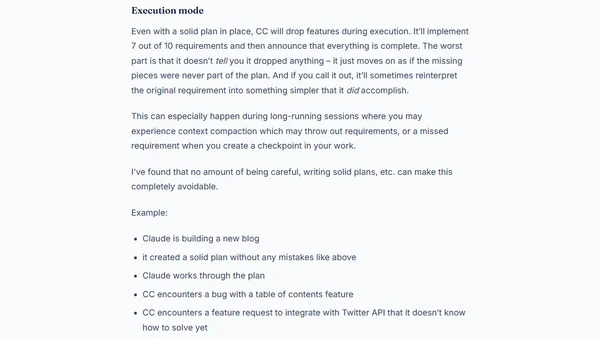
A developer shares critical drawbacks of using Claude Code for AI-assisted programming, focusing on hidden issues like problematic test generation and maintenance challenges.
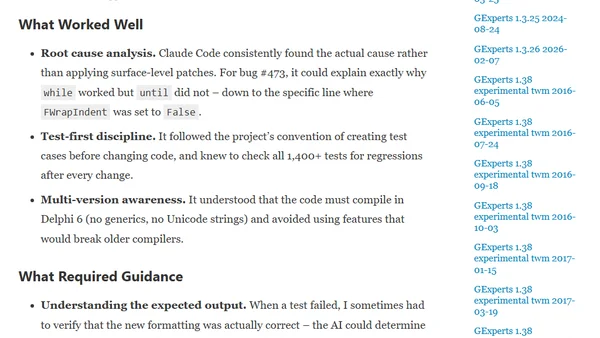
Using Claude Code AI to fix complex bugs in the GExperts Delphi code formatter, including indentation issues in anonymous functions and repeat-until loops.
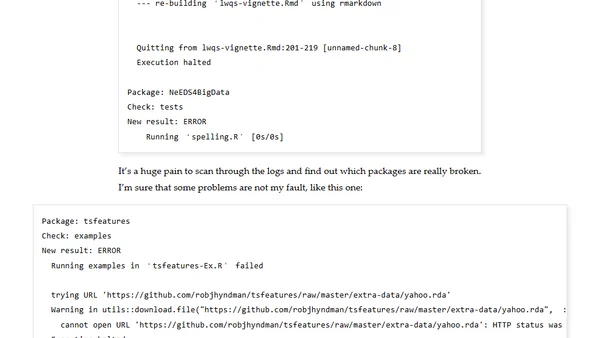
A guide for R package maintainers on using a custom JavaScript tool to parse and organize lengthy CRAN reverse dependency check logs into manageable tabs.
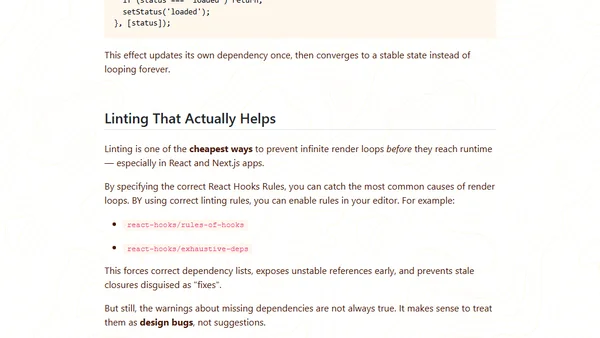
A guide to identifying, debugging, and preventing infinite render loops in React applications, focusing on root causes like unstable references.
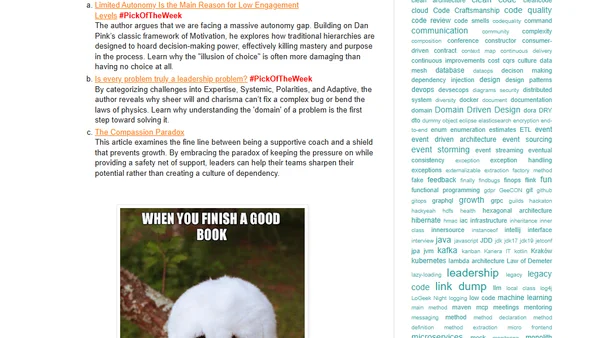
A weekly collection of curated articles on software architecture, development, DevOps, code quality, and tech leadership.
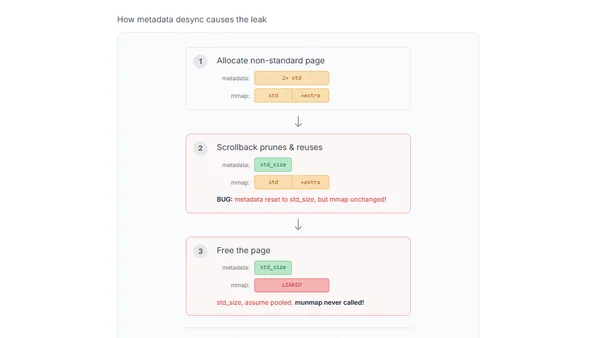
A technical deep dive into diagnosing and fixing a major memory leak in the Ghostty terminal emulator, triggered by specific CLI applications.
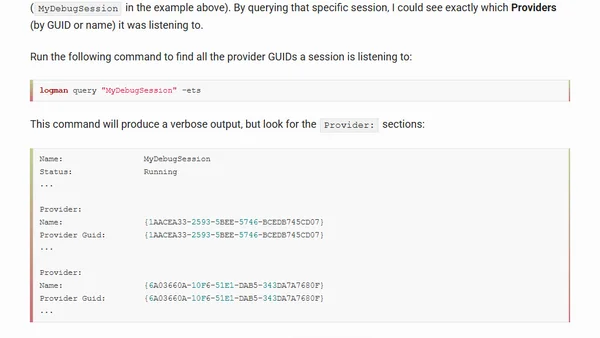
A technical guide on debugging ETW event drops in high-throughput Windows applications, covering session analysis and bottleneck identification.
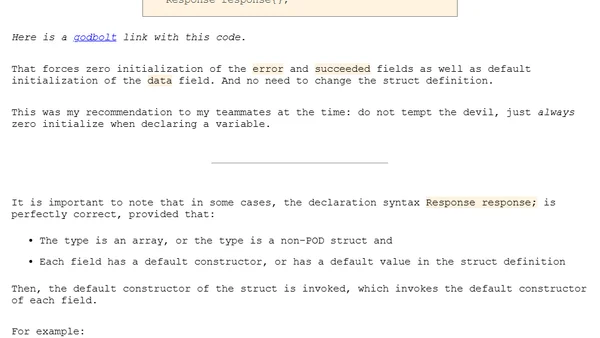
A developer recounts a production C++ bug caused by undefined behavior, explaining how uninitialized struct members led to a critical API error.
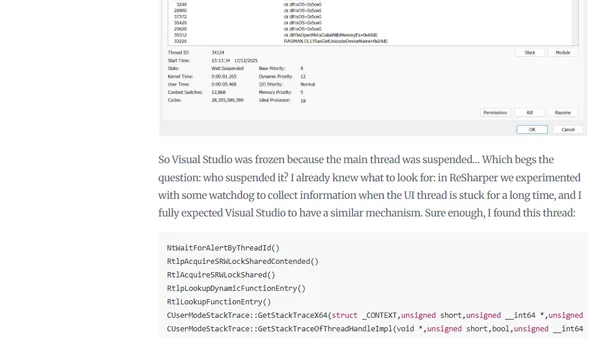
A developer investigates a Visual Studio deadlock using profiling tools and memory dumps, revealing an unexpected thread suspension issue.
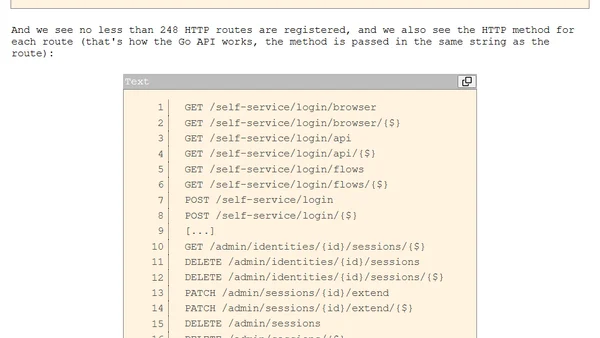
Using DTrace to dynamically list all HTTP routes registered in a Go application, useful for debugging and understanding runtime features.
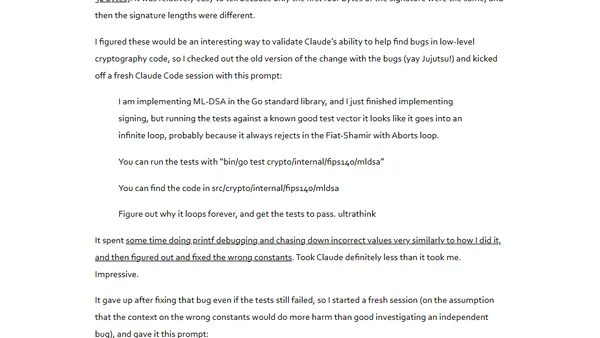
A developer uses Claude Code to debug a complex bug in their Go implementation of the ML-DSA post-quantum cryptography algorithm.
Explains how to fix missing custom logs in .NET Isolated Azure Functions by adjusting the default Application Insights logging filter.
A developer shares a systematic approach to debugging, using a real bug example and contrasting it with AI's limitations.
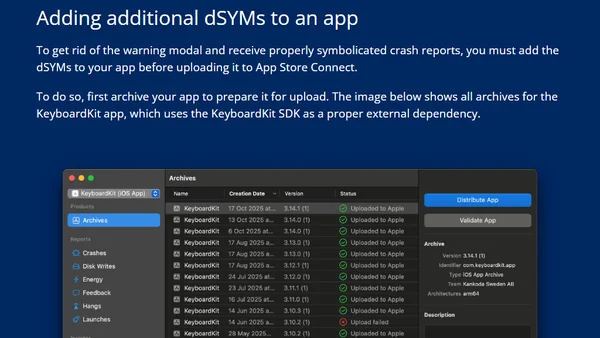
Explains how to add dSYM files from a closed-source Swift SDK to an app to get fully symbolicated crash reports for debugging.
A review of the book 'Troubleshooting Java,' covering debugging, profiling, and performance tuning for Java applications.