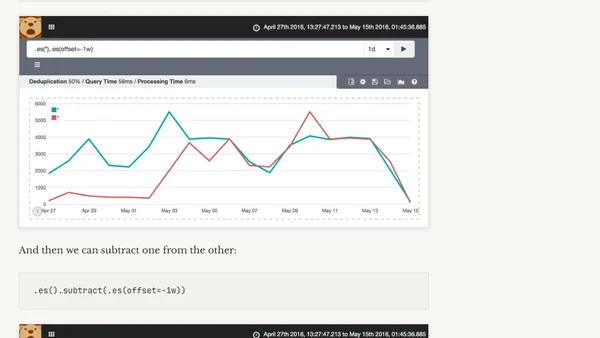
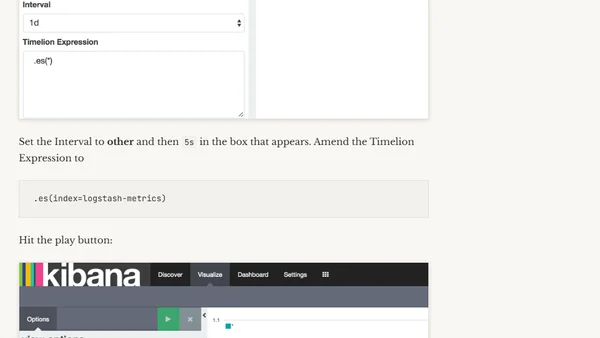
Azure Arc enabled Data Services, part 13 – Monitoring with Grafana & Kibana
A technical guide on using Grafana and Kibana for monitoring Azure Arc-enabled SQL Managed Instances, part of a larger series on Azure Arc Data Services.
A tutorial on setting up a logging stack with Elasticsearch, Kibana, and Fluentd on a Kubernetes cluster for centralized log management.
A guide to using Docker images for the ELK-B stack (ElasticSearch, Kibana, Beats) to monitor and log applications running in Docker Swarm.
A tutorial on setting up Elasticsearch and Kibana with an ASP.NET Core application using Docker and Serilog for logging.
A technical guide on using Kibana Timelion's holt function for anomaly detection on system CPU metrics from Metricbeat data.
Learn to integrate ElasticSearch and Kibana with Service Fabric for advanced log monitoring and visualization of application diagnostics.
A technical guide on using Kibana Timelion to calculate and visualize the difference between current data and data from one week ago.
A guide to monitoring Logstash ingest rates using the Elastic stack (Elasticsearch, Kibana, Timelion) instead of external tools like InfluxDB and Grafana.
A guide on using R and dplyr to denormalize and join datasets for analysis in Kibana/Elasticsearch, using a road accident data example.
A guide to using Kibana Timelion for time series analysis, covering installation, basic queries, data manipulation, and integrating external data from Quandl.
A technical guide on building a read-only IRC client using the Elastic Stack (Logstash, Kibana, Elasticsearch) to log and visualize channel messages.
A technical guide on integrating Couchbase with Elasticsearch and Kibana to perform real-time visitor analysis and overcome search limitations.