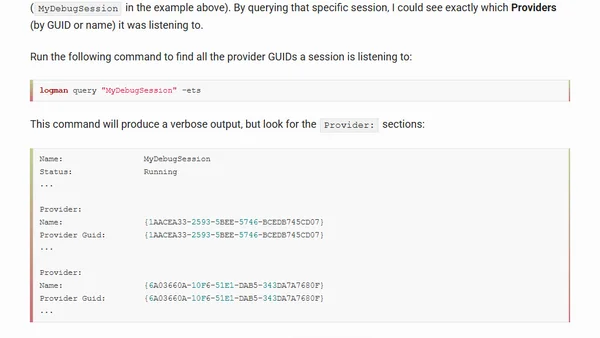
Debugging ETW Event Drops in High-Throughput Applications
A technical guide on debugging ETW event drops in high-throughput Windows applications, covering session analysis and bottleneck identification.

A technical guide on debugging ETW event drops in high-throughput Windows applications, covering session analysis and bottleneck identification.
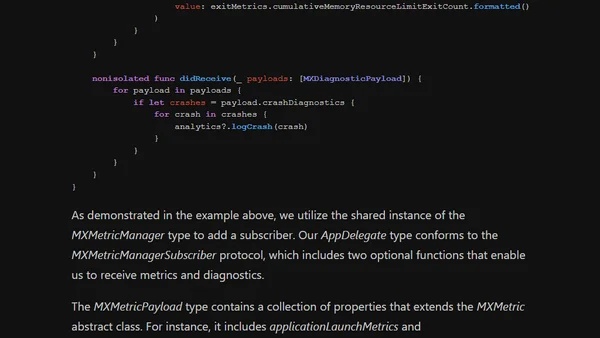
Learn how to use Apple's MetricKit framework to collect detailed app performance diagnostics and build a monitoring dashboard.
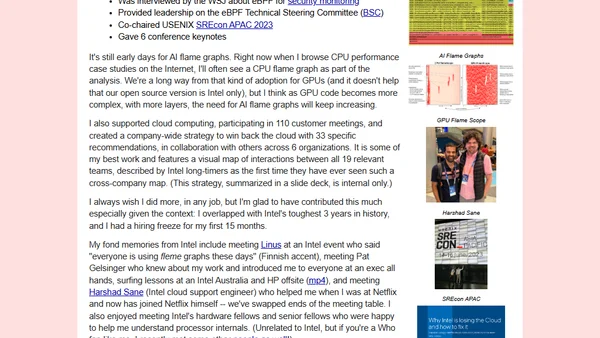
A senior engineer reflects on his 3.5 years at Intel, highlighting contributions to AI flame graphs, eBPF, cloud strategy, and open-source performance tools.
Introduces vtime, a custom command-line utility for tracking and displaying elapsed time of long-running processes in real-time.

Explains why P95 and P99 latency metrics are crucial for understanding real user experience, not just average response times.

Explains CPU throttling in Kubernetes, how to identify it via metrics, and discusses a Linux kernel regression causing the issue.

A guide to optimizing MySQL query performance in Spring applications using the Releem monitoring and analysis tool.
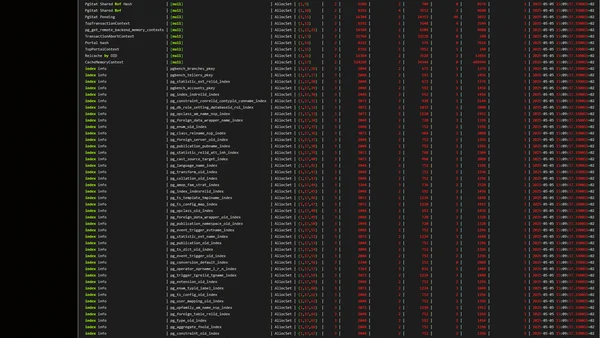
PostgreSQL 18 adds a function to retrieve detailed memory context statistics from any backend or auxiliary process for debugging memory issues.

Announcing a full-day SQL Server performance monitoring and troubleshooting PreCon session at SQLSaturday NYC 2025, led by a former Microsoft PM.
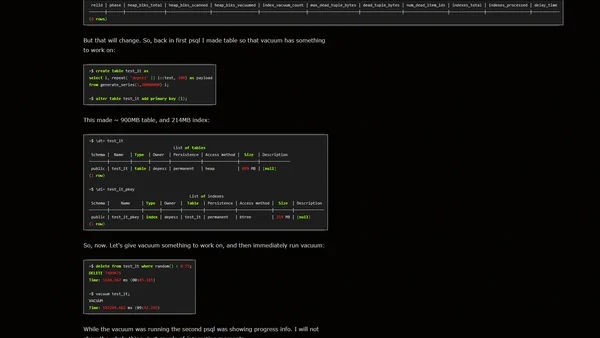
PostgreSQL 18 adds tracking of cost-based vacuum delay time to progress views, helping monitor performance impact of vacuum operations.
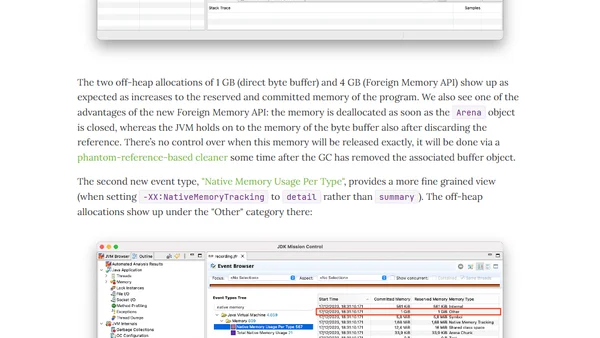
Explains how to use JDK Flight Recorder (JFR) to track Java Native Memory (NMT) for performance analysis, with examples.
Discusses tools and challenges for measuring website carbon emissions, advocating for reporting to raise awareness and encourage sustainable web development.
Explores using eG Enterprise for comprehensive monitoring and performance insights in Azure Virtual Desktop environments.
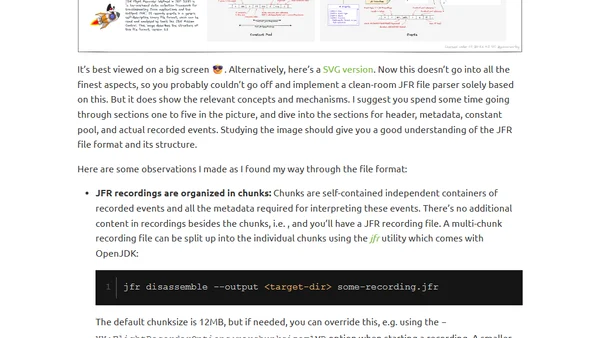
An in-depth exploration of the undocumented JDK Flight Recorder (JFR) file format, detailing its structure and uses.
A guide to measuring daily Core Web Vitals using Google Analytics and external tools, bypassing the standard 28-day reporting window.
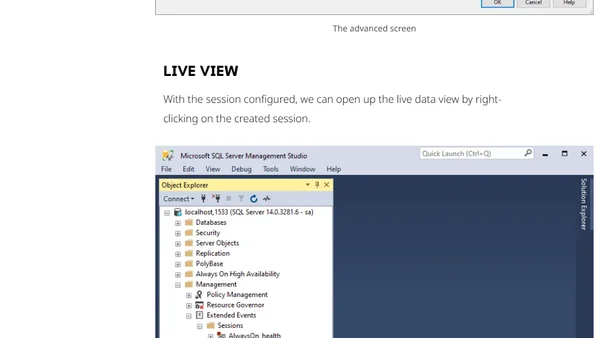
A guide to converting SQL Server Profiler templates to Extended Events (XEvents) sessions using the SSMS GUI for performance monitoring.
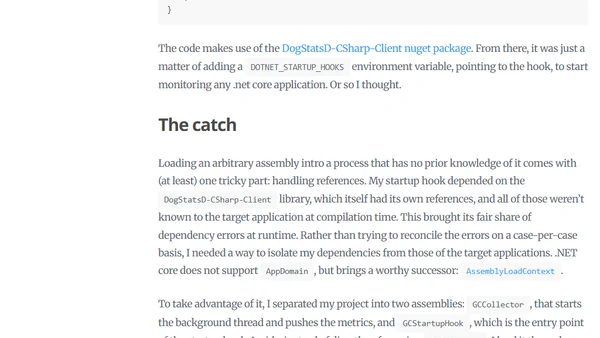
Explains how to use .NET startup hooks to monitor garbage collection statistics by injecting a polling thread into applications.
Explains how to use React's experimental interaction tracing API to monitor user actions and their performance impact.
A guide on using React's Profiler API to monitor and track component render performance in production applications.
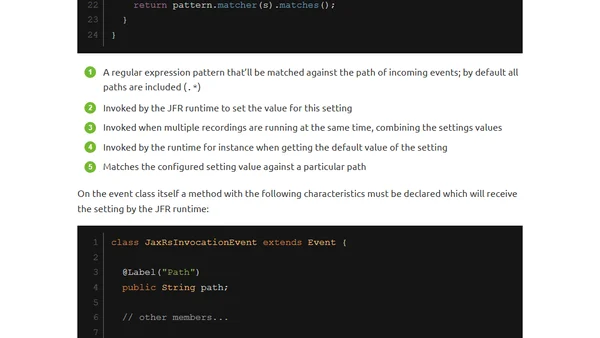
Explains how to use custom JDK Flight Recorder events to monitor REST API performance, including request counts and durations, with Java 14+ streaming.