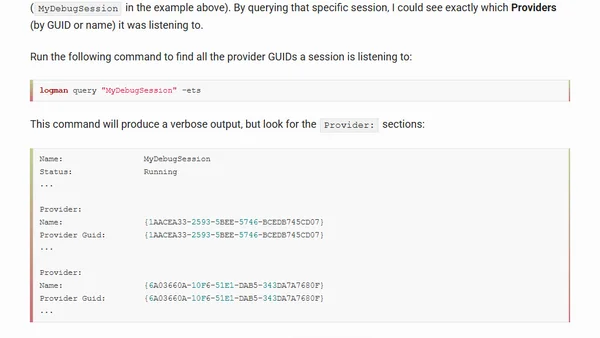
Debugging ETW Event Drops in High-Throughput Applications
A technical guide on debugging ETW event drops in high-throughput Windows applications, covering session analysis and bottleneck identification.

A technical guide on debugging ETW event drops in high-throughput Windows applications, covering session analysis and bottleneck identification.
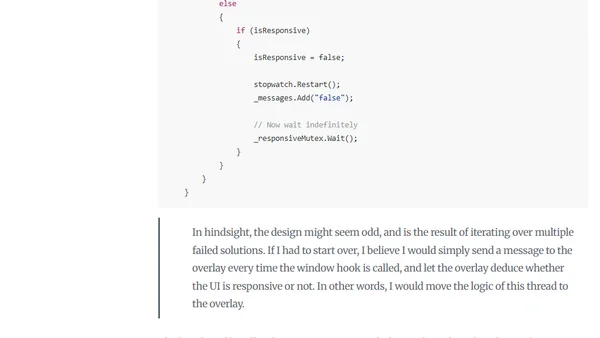
A developer details building a custom profiler tool to measure and visualize UI responsiveness and typing latency in ReSharper for performance optimization.
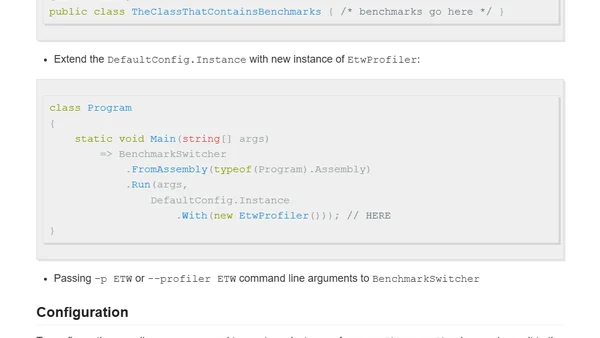
Introducing EtwProfiler, a new BenchmarkDotNet diagnoser for profiling .NET code on Windows and exporting trace data for analysis.
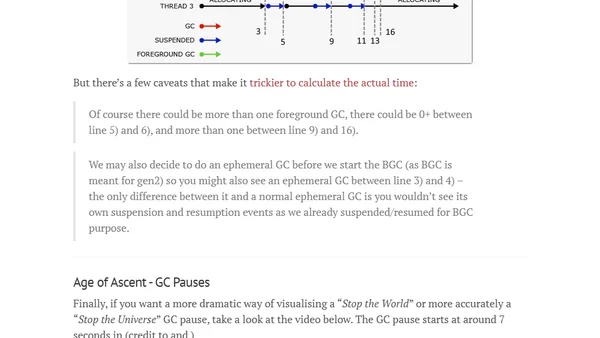
A deep dive into visualizing and understanding the .NET Garbage Collector's behavior using a custom tool and ETW events.