5/12/2026
•
EN
Lessons Learned Building High-Performance Rust Profiler
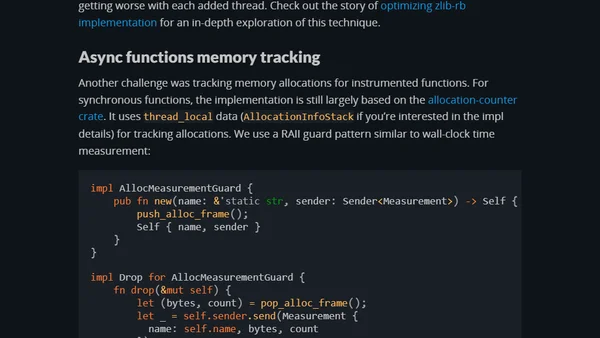
Design decisions and performance challenges building a high-performance Rust profiler, covering low-level details like cache-line contention and async instrumentation.