
MySQL Performance Tuning with Releem
A guide to using Releem, a tool for MySQL performance tuning and monitoring, including installation and configuration steps.

A guide to using Releem, a tool for MySQL performance tuning and monitoring, including installation and configuration steps.
A guide to help large organizations decide whether to use Datadog's multi-org feature, covering key factors like company structure, data correlation, and cost.

A critique of semantic versioning in observability marketing, arguing that terms like 'Observability 2.0' describe a real technical shift despite overuse.

Explains the core technical shift from multi-tool Observability 1.0 to a unified, event-based Observability 2.0.
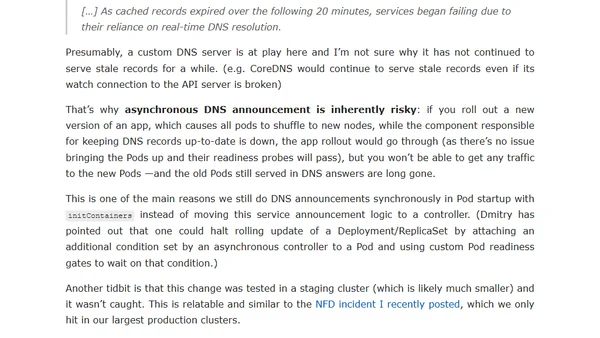
Analysis of OpenAI's Kubernetes outage, focusing on API server overload and DNS service discovery issues in large-scale clusters.
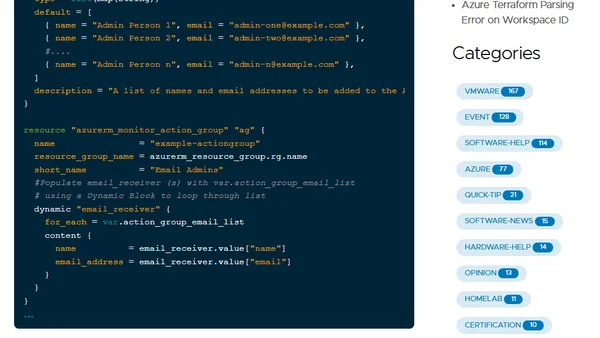
A technical guide on creating Azure Action Groups for notifications using Terraform and PowerShell code examples.
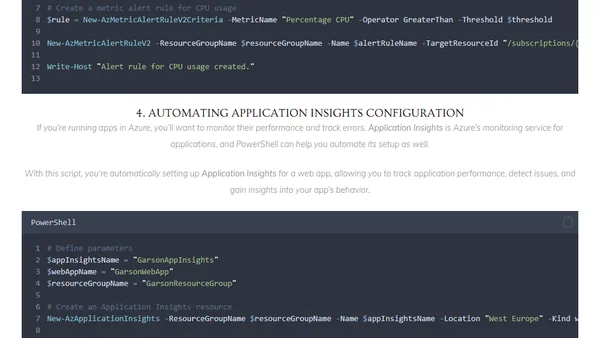
A guide to automating Azure monitoring and alert setup using PowerShell within Infrastructure as Code (IaC) deployments.

Explores the architecture and demo of an Enterprise Chat AI solution using Azure OpenAI and AI Search, part of a technical series.

Explains how Kubernetes exposes metrics for monitoring, covering the Metrics API, Kubelet/cAdvisor, and different metric categories.
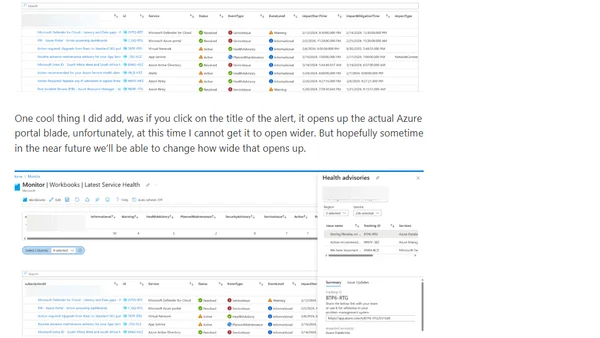
A guide to creating an Azure Service Health dashboard using Azure Resource Graph Explorer, including KQL queries and a shared workbook.

Analyzes the rising costs and diminishing value of traditional observability tools, exploring the 'cost multiplier' effect of using multiple overlapping telemetry systems.
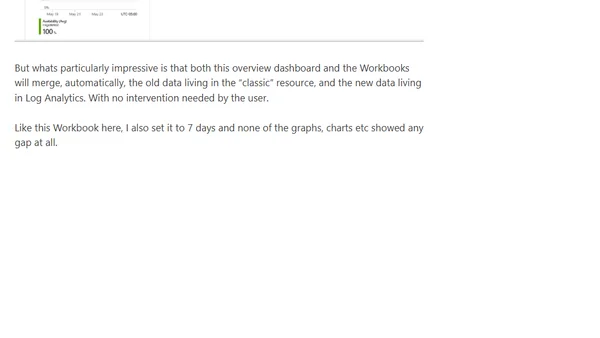
A guide to migrating from Classic Application Insights to the new Workspace-based model, covering the process, data merging, and alert reconfiguration.
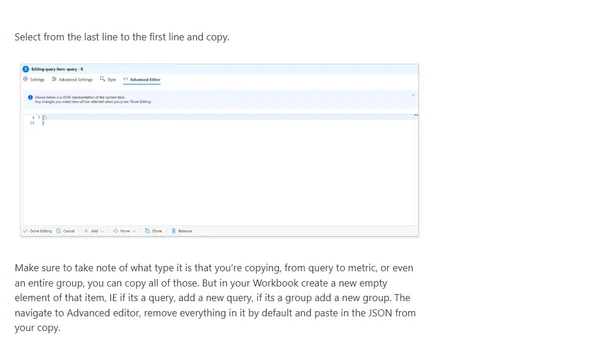
A guide on copying specific elements like queries, metrics, or groups between Azure Workbooks using the Advanced Editor and JSON.
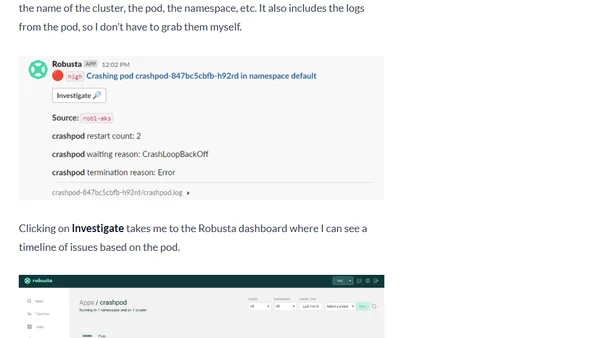
A tutorial on setting up a comprehensive Kubernetes monitoring stack using Prometheus, Grafana, and the Robusta platform.

A developer's monthly digest covering books on Go, TypeScript, and Prometheus, plus articles on AI, work culture, and teaching observability.
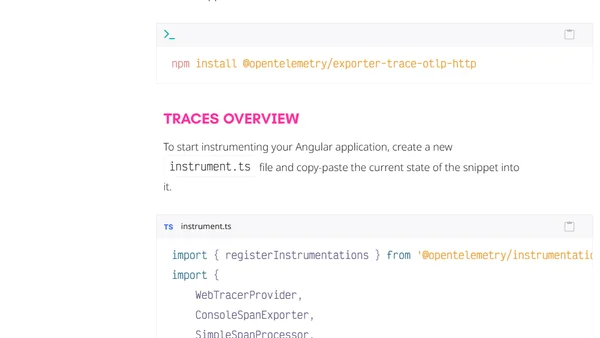
A guide to implementing OpenTelemetry for monitoring and observability in an Angular application using the browser SDK.
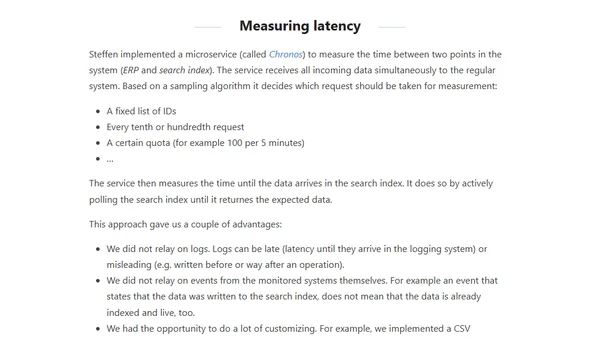
A case study on implementing a custom microservice (Chronos) to measure end-to-end latency in a microservice architecture.
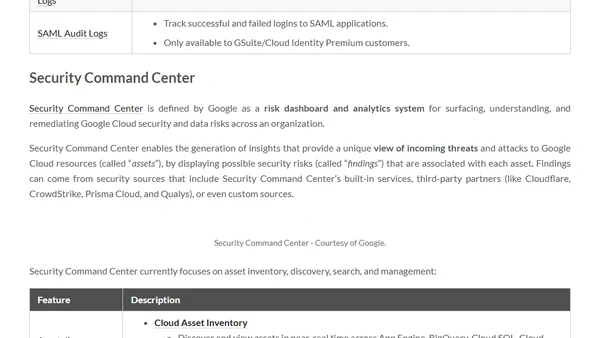
A guide to designing a state-of-the-art, multi-account security logging and monitoring platform in Google Cloud Platform (GCP).
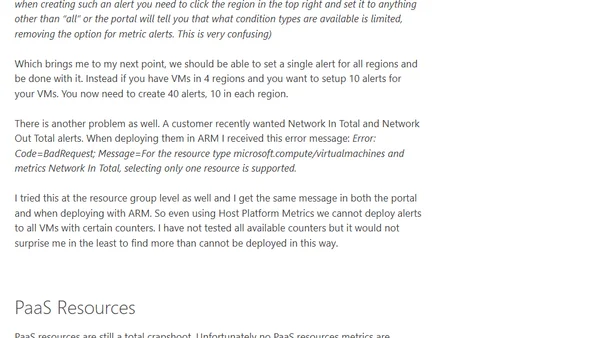
Explores challenges and solutions for setting up Azure alerts at scale, focusing on Log Analytics and host platform metrics for IaaS VMs.
A guide to setting up low-cost website monitoring for Azure Static WebApps using Application Insights URL ping tests and alerts.