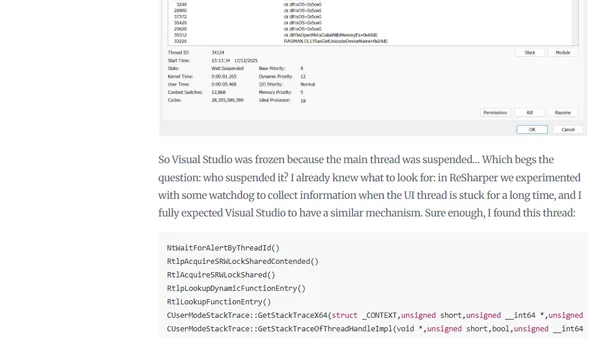
Investigating a deadlock in Visual Studio
A developer investigates a Visual Studio deadlock using profiling tools and memory dumps, revealing an unexpected thread suspension issue.

A developer investigates a Visual Studio deadlock using profiling tools and memory dumps, revealing an unexpected thread suspension issue.
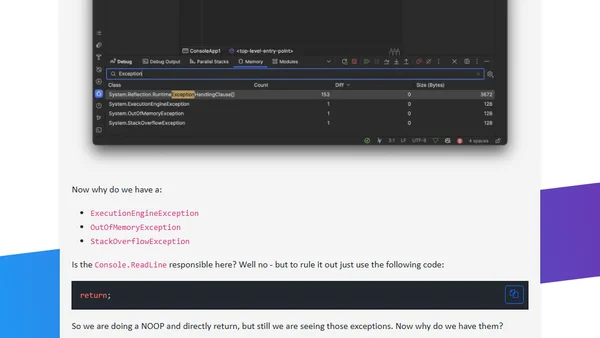
Explains why certain exception instances like OutOfMemoryException are pre-allocated in .NET memory dumps, even in simple applications.
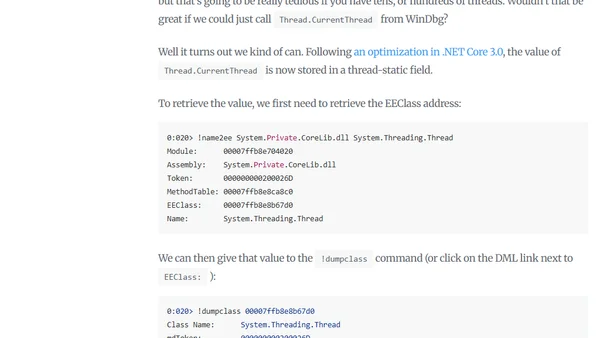
A technical guide on using WinDbg to locate and switch to a specific managed thread by its ID in a .NET memory dump.
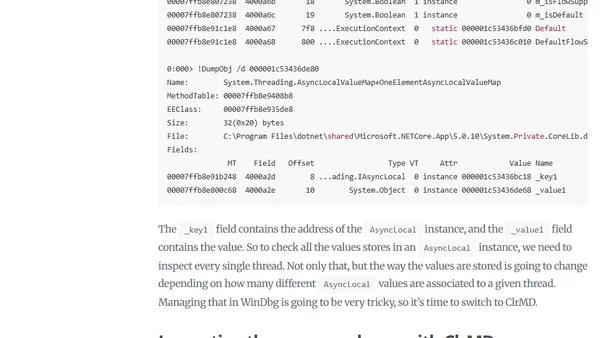
A technical guide on how AsyncLocal values are stored in .NET and the process of retrieving them from a memory dump using WinDbg.

A deep dive into debugging an AccessViolationException in .NET's ObjectNative::IsLockHeld method, tracing orphaned locks in an Orchard application.
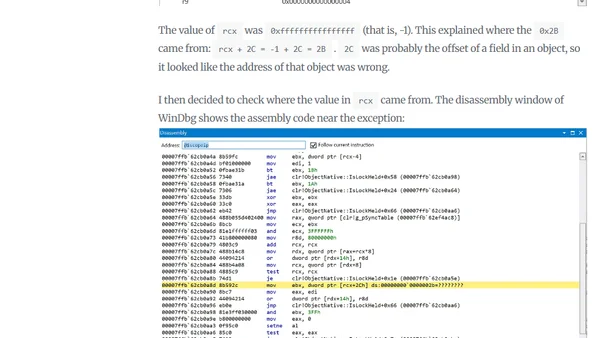
A deep-dive investigation into an AccessViolation crash in the .NET runtime's ObjectNative::IsLockHeld method, encountered while testing a tracer.
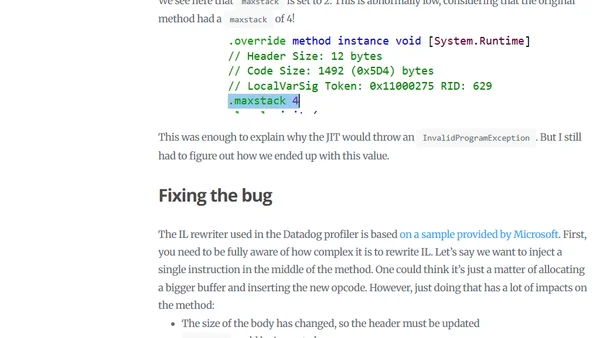
Final part of debugging an InvalidProgramException caused by a profiler bug, focusing on analyzing faulty IL code from a memory dump.
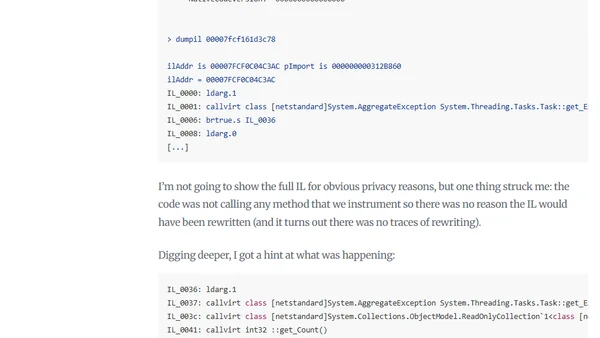
A deep dive into debugging a rare .NET InvalidProgramException caused by faulty IL generation in Datadog's automated instrumentation.
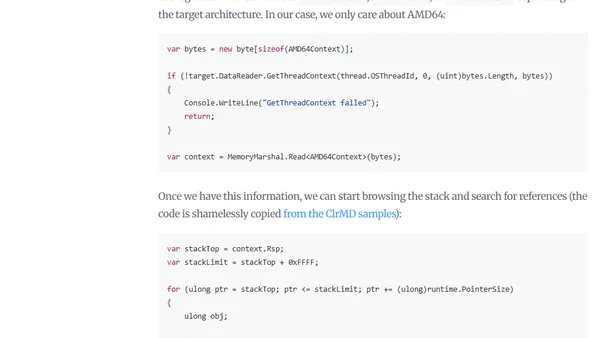
Explores using ClrMD to dump stack objects from .NET threads, comparing Windows and Linux behavior and uncovering a platform-specific limitation.