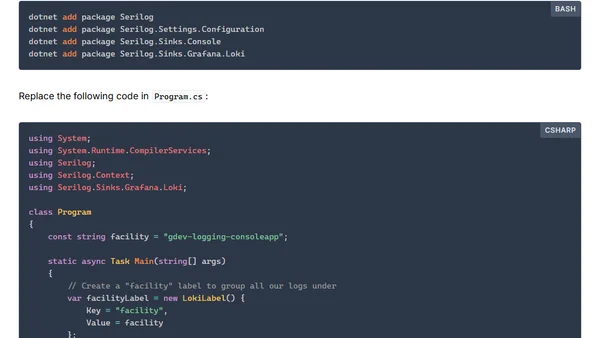
C#: Logging with Grafana & Loki
A guide to setting up centralized logging for C# applications using Grafana and Loki, including infrastructure setup and code integration.

A guide to setting up centralized logging for C# applications using Grafana and Loki, including infrastructure setup and code integration.
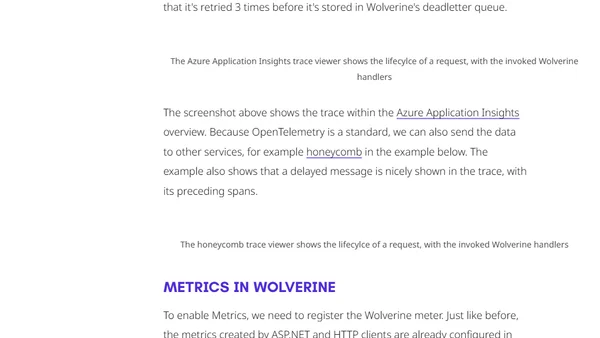
Explores how to enable OpenTelemetry observability in Wolverine, highlighting its built-in tracing and metrics capabilities.

Explains why traditional debugging fails for LLMs and advocates for observability-driven development to manage their non-deterministic nature in production.
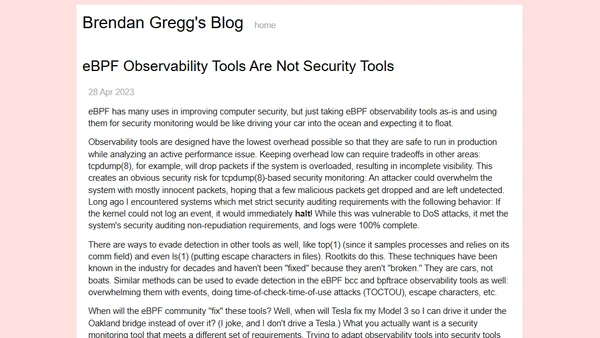
Explains why eBPF observability tools, designed for low overhead, are not suitable for security monitoring due to evasion risks.

A developer's monthly digest covering books on Go, TypeScript, and Prometheus, plus articles on AI, work culture, and teaching observability.
Brendan Gregg's SREcon22 APAC keynote on the future of computing performance, covering new developments and predictions.
![Ultimate Guide: NestJS Tracing with Open Telemetry [Updated 2022]](https://alldevblogs.blob.core.windows.net/thumbs/article-781b039e77b2-full-305c7e7b.webp)
A tutorial on implementing distributed tracing in NestJS applications using the Open Telemetry framework for observability.
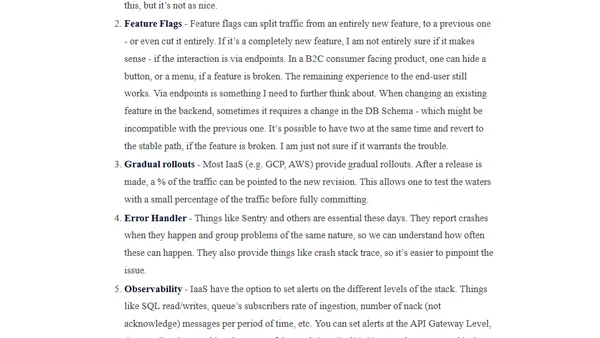
A developer discusses key considerations for releasing new features in a B2B SaaS environment, including logs, feature flags, and observability.
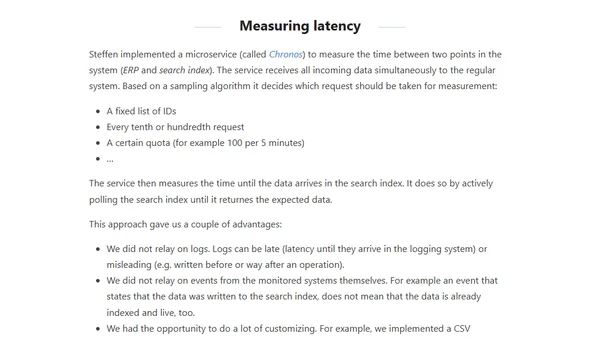
A case study on implementing a custom microservice (Chronos) to measure end-to-end latency in a microservice architecture.
The article discusses the shift from traditional debugging methods like printf to modern observability tools and structured event systems for distributed applications.
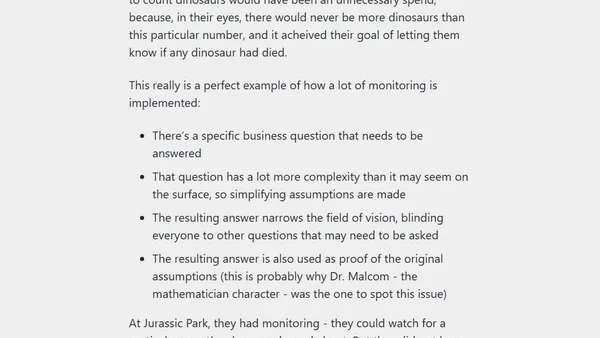
Explores the connection between observability in IT systems and the dinosaur counting system from Jurassic Park, using the story to explain monitoring concepts.
Learn how to use OpenTelemetry to monitor, identify, and fix common database performance issues in a .NET application.
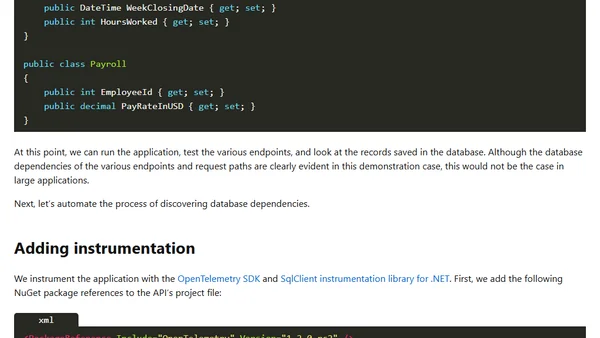
Using OpenTelemetry to identify and manage database dependencies in microservices architectures.

A critique of traditional metrics for observability, arguing they are limited for debugging unknown issues but still valuable for system health monitoring.
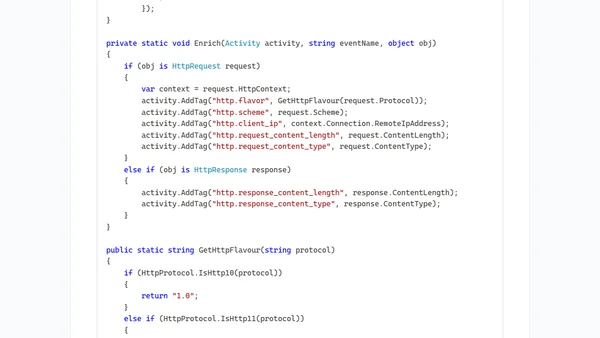
A guide to advanced OpenTelemetry tracing configuration for ASP.NET Core applications, moving beyond basic setup to optimize performance and data collection.
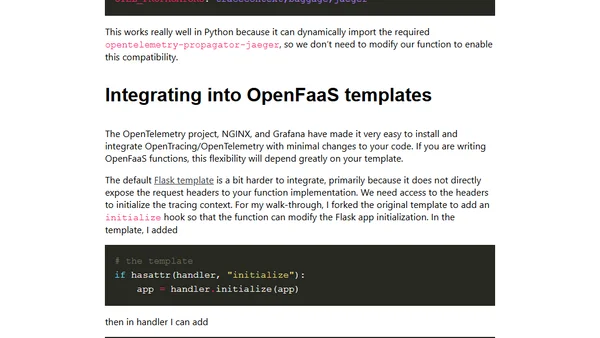
A developer's experience and commentary on integrating OpenTelemetry for tracing and observability within Python Flask functions on OpenFaaS.
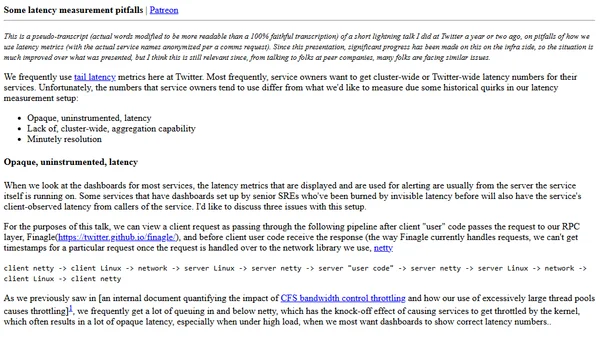
A discussion of common pitfalls in measuring tail latency metrics in distributed systems, using examples from Twitter's infrastructure.
Discusses the appropriate cost for an observability stack, suggesting a rule of thumb of 20-30% of infrastructure spend.

A critique of static dashboards for debugging, arguing they encourage pattern-matching over systematic problem-solving in software engineering.
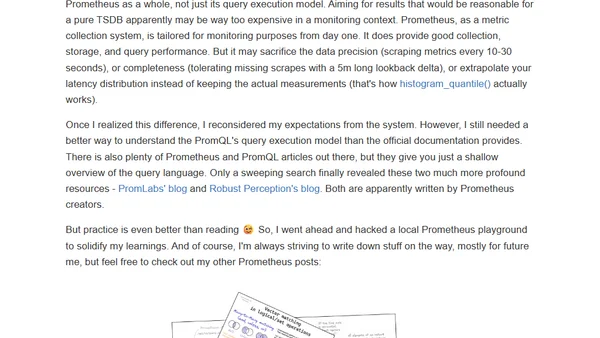
Explains why Prometheus is fundamentally a monitoring system, not just a time-series database, and clarifies its design and query behavior.