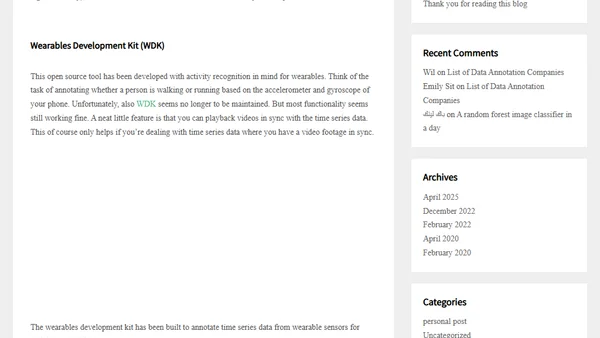
Time Series Annotation Tools
An overview of open-source tools for annotating time series data, including their features, maintenance status, and use cases.
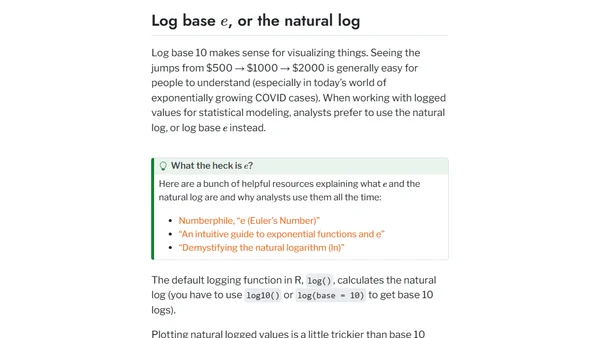
A guide on using the scales package in R's ggplot2 to format axes with natural log and base 10 log scales for better data visualization.
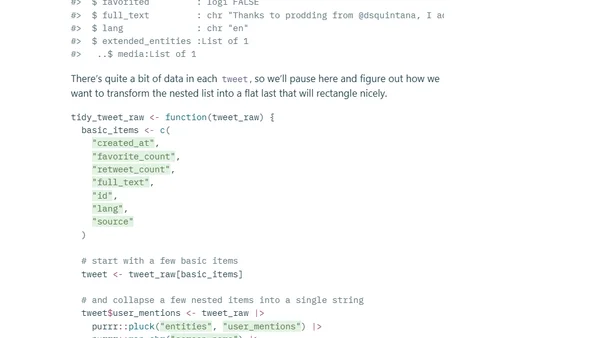
A technical tutorial on using R to read, analyze, and visualize your downloaded Twitter archive data, including tweets, likes, and ad history.
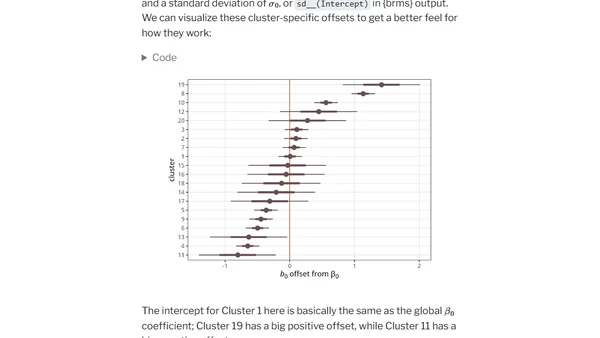
A guide to calculating marginal and conditional effects in generalized linear mixed models (GLMMs) using the R {marginaleffects} package.
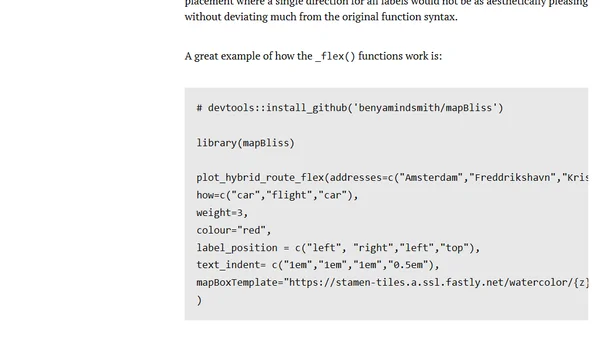
Introduces new _flex() functions in the mapBliss R package for custom, per-label positioning on maps, enhancing map art creation.
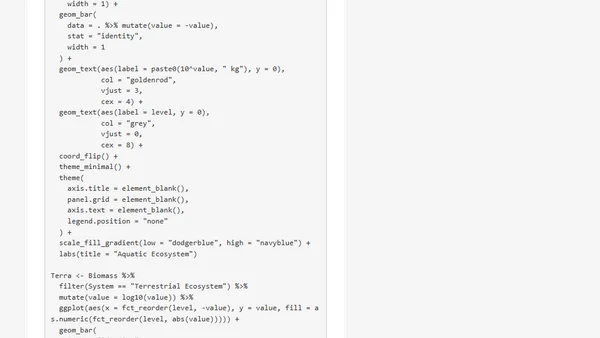
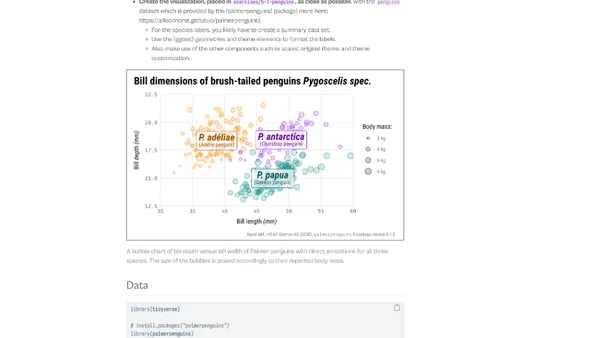
A tutorial on creating biomass pyramid and funnel plots using ggplot2 in R, including code examples and customization tips.
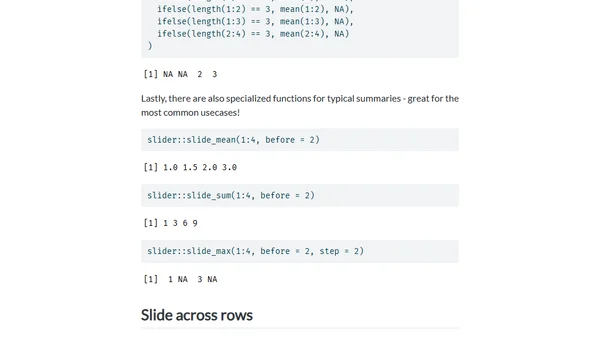
A tutorial demonstrating how to use the R `slider` package for rolling window analysis, using NFL quarterback performance data as an example.
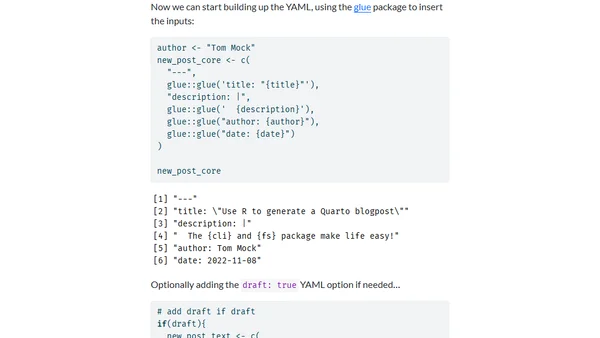
A tutorial on creating an R function to automate the generation of new Quarto blog posts, including directory structure and YAML front matter.
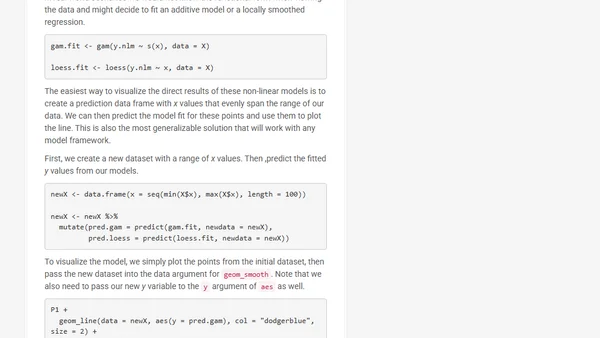
A tutorial on visualizing custom statistical models, including linear and non-linear fits, using ggplot2 in R for data science workflows.
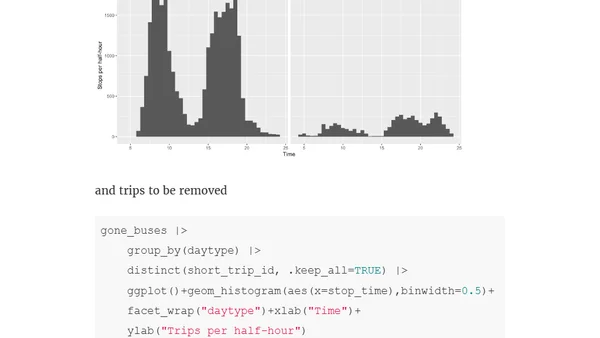
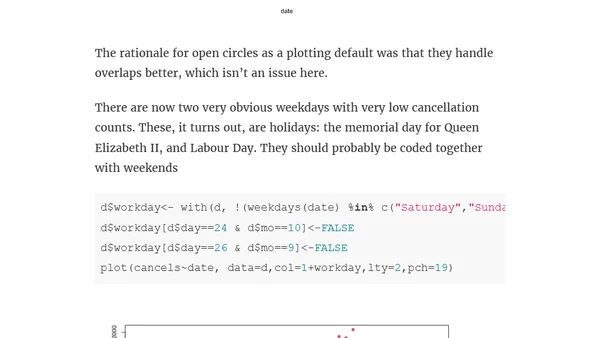
Analysis of Auckland bus cancellations using R and GTFS data to visualize which trips are being removed from the timetable.
A technical walkthrough of visualizing and improving a graph of Auckland bus cancellation data using R, focusing on data representation and coding techniques.
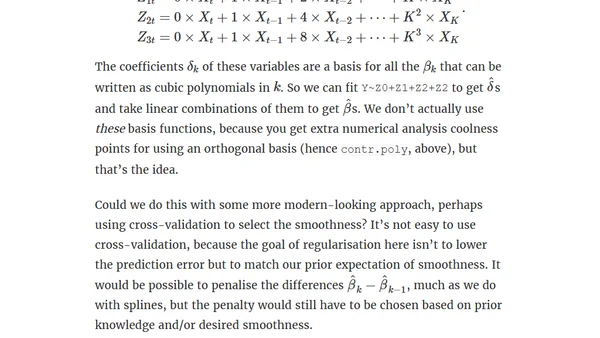
A technical article explaining polynomial distributed lag models for regularization in time-series analysis, including code archaeology and R implementation.
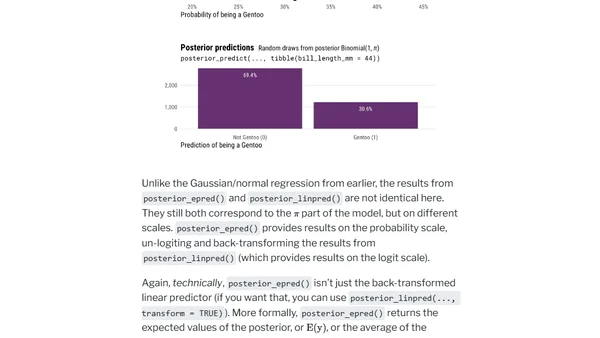
Explains the differences between Bayesian posterior predictions, linear predictions, and expected predictions using R, brms, and Stan.
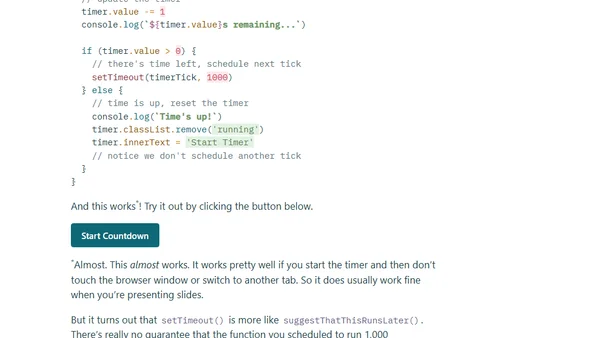
Announcing the release of countdown v0.4.0 on CRAN, a flexible timer for R presentations in xaringan, Quarto, R Markdown, and Shiny.
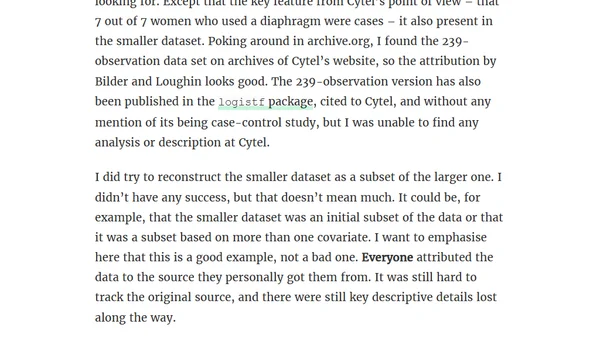
A data scientist details the complex process of tracing the original source and context of a medical dataset used in statistical software packages.
A recap of a 2-day workshop on creating advanced, visually appealing graphics using the ggplot2 package in R, taught at rstudio::conf 2022.
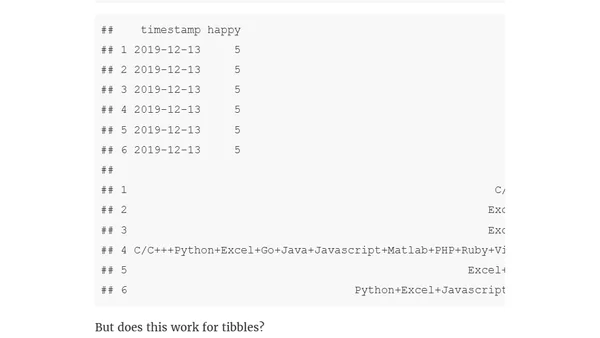
A technical article about improving the R package 'rimu' for handling multiple-response categorical data within data frames.
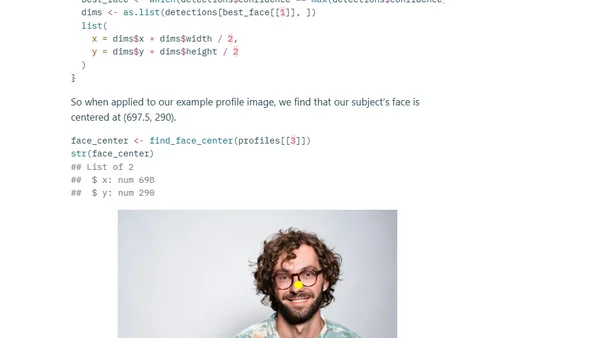
Using R and the magick package to automate the processing and centering of profile pictures for a conference, saving manual effort.
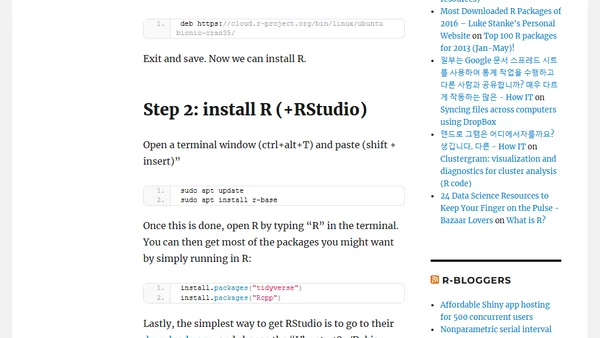
A technical guide for installing R version 3.6.3 on Linux Mint 19.x, including steps to remove old versions and configure repositories.
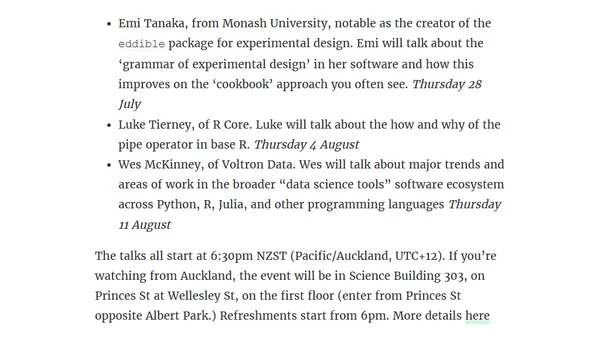
Announcing the 2022 Ihaka Lectures, featuring online talks by Emi Tanaka, Luke Tierney, and Wes McKinney on R, data science tools, and experimental design.