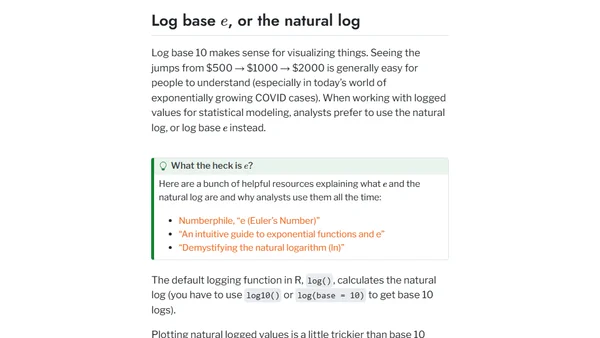
How to use natural and base 10 log scales in ggplot2
Read OriginalThis technical tutorial explains how to use the modern {scales} R package to adjust and format x- and y-axis scales in ggplot2 for both base 10 and natural log (ln) transformations. It demonstrates the process using Gapminder data, showing how to handle skewed data distributions and create clear, labeled log-scale plots, updating older deprecated methods.
0 comments
Comments
No comments yet
Be the first to share your thoughts!
Browser Extension
Get instant access to AllDevBlogs from your browser
Top of the Week
No top articles yet