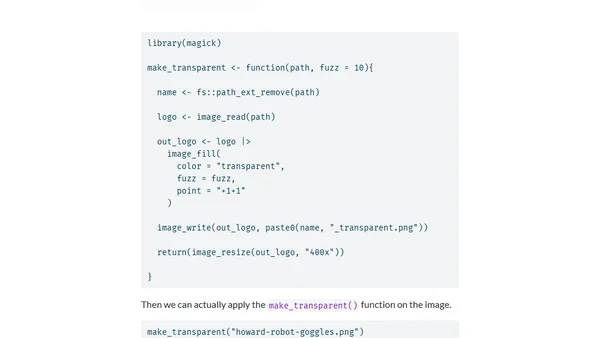
Removing background from GenAI art
A quick tutorial on using the R magick package to remove backgrounds from AI-generated art, making images transparent.
Tom Mock’s blog focuses on R programming, data visualization, and reproducible research. He shares practical tutorials for RMarkdown, Quarto, tidyverse, and creative data presentation techniques.
20 articles from this blog
A quick tutorial on using the R magick package to remove backgrounds from AI-generated art, making images transparent.
A tutorial demonstrating how to use the R `slider` package for rolling window analysis, using NFL quarterback performance data as an example.
A tutorial on creating an R function to automate the generation of new Quarto blog posts, including directory structure and YAML front matter.
A tutorial on using the R magick package to programmatically add semi-transparent color overlays to images for better text readability.
Introducing gtExtras, an R package for creating beautiful, functional tables with opinionated themes and inline graphics.
A guide on capturing and formatting R session information (sessionInfo()) for reproducibility in blog posts and code sharing.
A guide to displaying literal RMarkdown code chunks verbatim in xaringan presentations using knitr options and cat().
A developer explains how using a minimal reproducible example (reprex) in R helps debug code and isolate issues, turning frustration into effective problem-solving.
A retrospective on the TidyTuesday data visualization project's three-year anniversary, highlighting community growth and the importance of accessibility in data viz.
A technical guide on how to include and organize non-blogpost content like slides and reports within a Distill blog built with RMarkdown.
A guide to creating and testing a custom R function for aligning first-row text in gt tables, including testthat integration.
Analyzes performance tradeoffs between SQL joins and CASE WHEN statements in R for data cleaning, focusing on speed and memory usage.
A technical tutorial on using the R magick package to remove white backgrounds from NHL player headshots for data visualization.
A tutorial on using the R magick package and OCR to extract tabular data from images, specifically screenshots of data tables shared online.
A personal review of 2020 focusing on the growth of the #TidyTuesday data visualization project in the R community, with code and analysis.
A guide to creating and applying custom themes in ggplot2 for R to enhance data visualizations for communication and storytelling.
A guide on extracting and parsing JSON data from websites and public APIs using R, focusing on converting nested JSON into tidy dataframes.
A technical guide on creating and customizing bullet chart variants using R and ggplot2, including code examples and comparisons of different approaches.
A guide on embedding custom HTML and CSS within gt tables in R for enhanced table styling and formatting in R Markdown and Shiny.
A technical tutorial on using ggplot2 in R to create visualizations with embedded images, specifically NFL player headshots in QBR charts.