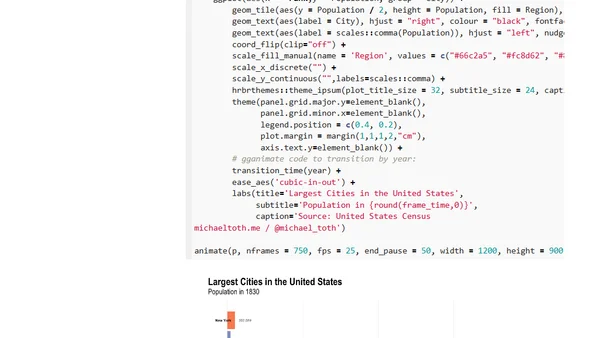
Handling ‘plausible values’ in surveys
A technical guide on handling 'plausible values' in survey data analysis using R, including code for the survey package.
A tutorial on creating line graphs in R using the ggplot2 package's geom_line function, with examples using the built-in Orange dataset.
A guide to understanding and using R's date format functions like as.Date(), as.POSIXct(), strftime(), and strptime() for data manipulation.
A tutorial on using the dplyr filter() function in R for data wrangling, focusing on selecting rows based on criteria.
A tutorial on creating an animated bar chart race in R to visualize the changing population rankings of US cities from 1790 to 2010.
A guide to interactively debug R package builds on Windows using AppVeyor's Remote Desktop feature when errors can't be replicated locally.
A guide on using CircleCI for continuous integration testing of R packages and projects, highlighting its advantages over Travis CI and AppVeyor.
A technical analysis of bus punctuality using Auckland Transport API data, with R code for data processing and visualization.
A guide on how to customize ggplot graphs to match your company's visual branding, making your data visualizations stand out and be more impactful.
A comparison of warranty disclaimers in statistical software licenses, focusing on R, SAS, Stata, and SPSS, and their implications for users.
Using R and the yacas library to solve a microeconomics optimization problem: finding the optimal consumption of pizza and yogurt given a budget and utility function.
A guide to six statistical methods (frequentist and Bayesian) for comparing group means, with R and Stan code examples.
Explores the statistical challenges of applying linear mixed models to complex survey data with multi-stage sampling, focusing on weighting issues.
A curated list of gift ideas for R programming enthusiasts, including books, cheatsheets, hex logos, art, and conference tickets.
Announcing the completion of the open-source book 'Geocomputation with R', detailing its collaborative creation, purpose, and availability.
Introduces covrpage, an R package for generating detailed unit test summary reports to build trust and show testing completeness in R packages.
A technical explanation of the svycontrast() function in R's survey package, covering linear and non-linear contrasts for statistical estimation.
A tutorial on using the infer package in R for hypothesis testing through simulation, following a modern statistical approach.
A technical tutorial on using the R plotly package to create interactive Gantt charts for project planning, specifically for a PhD thesis.
Introduces the 'namer' R package for automatically labeling unnamed R Markdown chunks to improve debugging and cache management.