Project planning with plotly
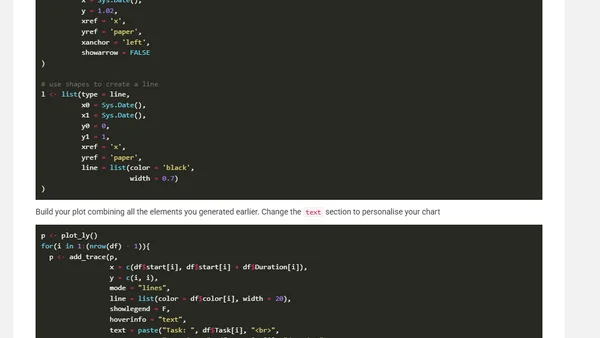
Read OriginalThis article provides a step-by-step guide on using the R plotly library to build interactive Gantt charts for project management. It details the process from installing necessary packages (RColorBrewer, readxl) to formatting data and customizing the chart's appearance, using the author's PhD thesis timeline as a practical example.
Comments
No comments yet
Be the first to share your thoughts!
Browser Extension
Get instant access to AllDevBlogs from your browser
Top of the Week
No top articles yet