How to Create a Bar Chart Race in R - Mapping United States City Population 1790-2010
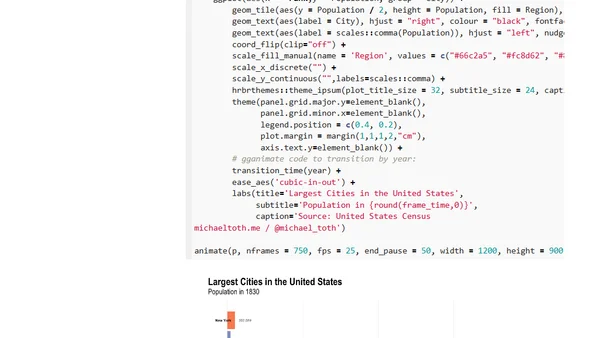
Read OriginalThis technical tutorial guides readers through creating an animated bar chart race in R, using U.S. Census data from 1790 to 2010. It covers loading packages like gganimate and tidyverse, processing historical city population data, and generating a visualization that shows how city population rankings have evolved over more than two centuries.
0 comments
Comments
No comments yet
Be the first to share your thoughts!
Browser Extension
Get instant access to AllDevBlogs from your browser
Top of the Week
No top articles yet