Azure Managed Prometheus and Grafana with Terraform – part 3
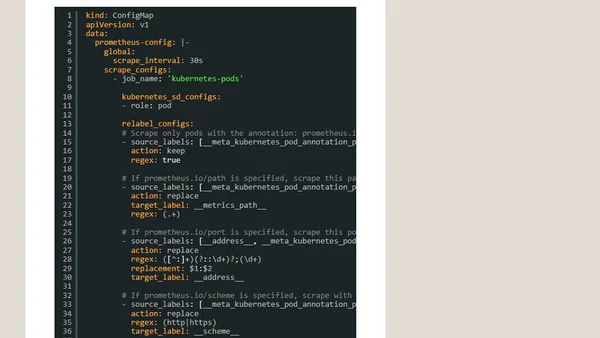
Read OriginalThis technical tutorial is part three of a series on setting up monitoring for Azure Kubernetes Service (AKS) using Azure Managed Prometheus and Grafana, provisioned with Terraform. It details the specific steps to configure Prometheus to scrape metrics from the ingress-nginx controller, create corresponding Grafana dashboards from JSON files, and troubleshoot configuration challenges using pod annotation-based scraping.
0 comments
Comments
No comments yet
Be the first to share your thoughts!
Browser Extension
Get instant access to AllDevBlogs from your browser
Top of the Week
No top articles yet