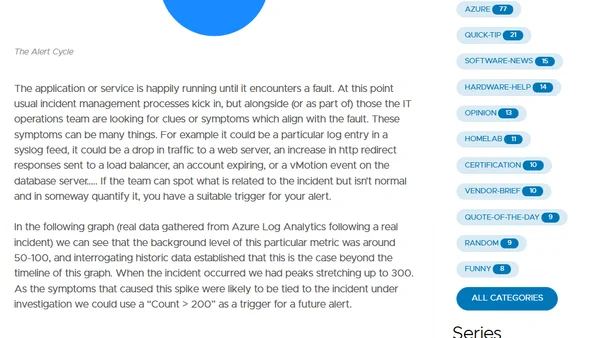
Alerting at Scale in Azure (Again)
Explores challenges and solutions for setting up Azure alerts at scale, focusing on Log Analytics and host platform metrics for IaaS VMs.
A guide to setting up low-cost website monitoring for Azure Static WebApps using Application Insights URL ping tests and alerts.
Learn how to implement and use the Python logging module to monitor events and analyze application performance.
Explores the connection between observability in IT systems and the dinosaur counting system from Jurassic Park, using the story to explain monitoring concepts.
Explores using eG Enterprise for comprehensive monitoring and performance insights in Azure Virtual Desktop environments.
A critique of traditional metrics for observability, arguing they are limited for debugging unknown issues but still valuable for system health monitoring.
Part 4 of a Kubernetes for Developers series, focusing on setting up monitoring with kube-prometheus-stack, Prometheus, and Grafana.
An independent web performance consultant explains the value they bring to organizations by focusing teams, sharing cross-client best practices, and driving measurable improvements.
A guide to setting up a free monitoring stack for Django applications, covering uptime, error reporting, logs, and performance.
A technical guide on integrating Azure Application Insights into an Angular app, covering installation, configuration, and error tracking.
Discusses the appropriate cost for an observability stack, suggesting a rule of thumb of 20-30% of infrastructure spend.
A critique of static dashboards for debugging, arguing they encourage pattern-matching over systematic problem-solving in software engineering.
A cheat sheet covering fundamental Prometheus concepts including metrics, labels, time series, and the scraping process.
A guide to learning PromQL by setting up a controlled Prometheus playground environment to test queries and understand core concepts.
Explains why Prometheus is fundamentally a monitoring system, not just a time-series database, and clarifies its design and query behavior.
A technical guide on setting up Prometheus and Grafana to monitor a ClickHouse database server, including installation and configuration steps.
Explains the importance of automated alerts in IT operations, detailing a cycle for identifying symptoms, creating triggers, and improving incident response.
A guide to visualizing network latency using ping_exporter, Prometheus, and Grafana for monitoring internet and device health.
A guide to Prometheus's aggregation functions like avg_over_time and sum_over_time for analyzing time series data, with pseudocode examples.
A curated list of innovative, engineering-focused tech companies based in New York City, highlighting their products and technical challenges.