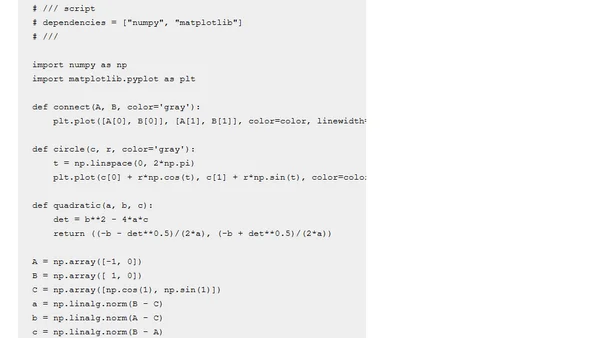
Scientific Computing in Python: Introduction to NumPy and Matplotlib
A tutorial on using NumPy for numerical arrays and Matplotlib for data visualization in Python, aimed at scientific computing and machine learning.
An introduction to scientific computing in Python using NumPy for numerical arrays and Matplotlib for data visualization.
Using Python and unsupervised machine learning to analyze Seattle bicycle count data and uncover insights about commuting work habits.
A critique of the 'jet' colormap in data visualization, with a Python function to convert colormaps to grayscale for analysis.
A tutorial on creating a stacked bar chart using Seaborn and Matplotlib by overlaying data series.
A technical guide to implementing Principal Component Analysis (PCA) for dimensionality reduction, comparing it with MDA and providing code examples.
Introducing mpld3's plugin framework for creating interactive matplotlib visualizations in the browser using D3.js.
Introducing mpld3, a tool that creates interactive D3.js visualizations from matplotlib plots for use in IPython notebooks.
Matplotlib 1.3 introduces a built-in plt.xkcd() function to easily create plots in the style of the popular XKCD webcomic.
A blog post demonstrating how to create a puzzling shape animation using Python's matplotlib and IPython notebook.
Introducing JSAnimation, a JavaScript package for embedding Matplotlib animations in IPython notebooks without external video codecs.
A tutorial on embedding matplotlib animations directly into IPython notebooks using HTML5 video encoding and custom display functions.
A PyCon/PyData attendee discusses the state of Python data visualization, comparing Matplotlib's strengths and limitations with newer tools like NodeBox OpenGL.
A tutorial on creating a 3D animation of the chaotic Lorenz system using Python, matplotlib, and SciPy.
A guide on using Python and matplotlib to extract and animate Super Mario Bros. graphics directly from the game's ROM data.
A tutorial on implementing the classic Minesweeper game using Python's Matplotlib library, focusing on interactive event callbacks.
A developer built a 3D interactive Rubik's Cube simulator in Python using matplotlib, explaining the rendering and rotation logic.
A tutorial on creating an interactive 3D viewer in Matplotlib using quaternions for rotation, addressing the library's 3D visualization limitations.
A guide to creating hand-drawn, XKCD-style plots in Matplotlib using custom code before the feature was officially added.
A tutorial on creating an animated optical illusion using Python's Matplotlib library, including code and explanations.