Creating A Stacked Bar Chart in Seaborn
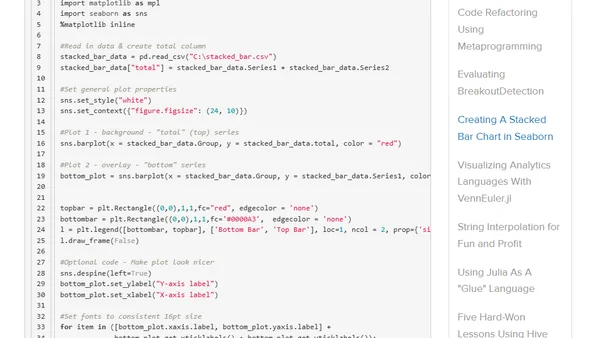
Read OriginalThis article details a method for creating a stacked bar chart in Seaborn, a Python data visualization library. It explains the author's process of overcoming the library's lack of a direct stacked bar function by manually summing data series and using Matplotlib's overlay capabilities, complete with a code example.
Comments
No comments yet
Be the first to share your thoughts!
Browser Extension
Get instant access to AllDevBlogs from your browser
Top of the Week
No top articles yet