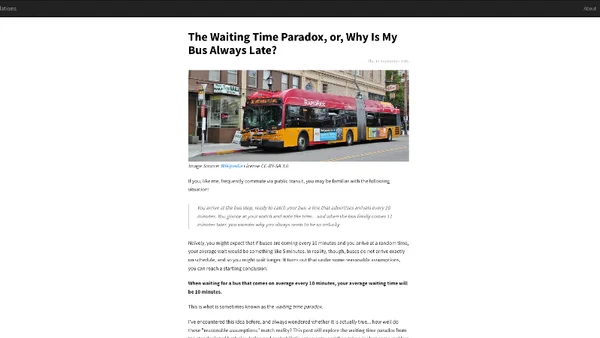
The Waiting Time Paradox, or, Why Is My Bus Always Late?
Explores the 'waiting time paradox' using probability, simulation, and real bus data to explain why average wait times often exceed the scheduled interval.
Jake VanderPlas is an astronomer and open-source leader, serving as Director of Open Software at the University of Washington’s eScience Institute. He writes and builds widely used Python tools for data science, machine learning, and scientific computing.
66 articles from this blog
Explores the 'waiting time paradox' using probability, simulation, and real bus data to explain why average wait times often exceed the scheduled interval.
A technical analysis of the Chutes & Ladders board game using Python simulation and Markov chain modeling to calculate expected game length.
A tutorial on using Cython to optimize slow numerical Python code, demonstrated with an Ising Model simulation.
A guide to installing Python packages in Jupyter Notebooks, explaining common issues with pip and conda, and how to ensure packages are available.
Analyzes line length distributions in popular Python packages, comparing them to Twitter's character limit analysis and exploring PEP8 style guide adherence.
A technical deep dive into exposing and accessing Python 3.6's private dictionary version number using ctypes.
A guide to the Lomb-Scargle periodogram, explaining its use, common misconceptions, and practical considerations for analyzing astronomical data.
Explores implementing group-by operations from scratch in Python, comparing performance of Pandas, NumPy, and SciPy for data aggregation.
A technical walkthrough of simulating a chaotic triple pendulum system in Python using Sympy and Kane's Method.
A video series on transitioning from interactive Jupyter data exploration to reproducible, packaged, and tested code for data analysis.
A developer clarifies common myths about Conda, explaining it's a general-purpose package manager distinct from Anaconda and not just for Python.
A tutorial on analyzing Seattle's Pronto CycleShare data using Python, Pandas, and the PyData stack for data science.
A tutorial on using Dask for out-of-core data analysis with a large OpenStreetMap dataset, demonstrating scalable Python data manipulation.
Compares frequentist and Bayesian approaches to statistical model selection, highlighting philosophical differences and computational trade-offs.
Using Python and unsupervised machine learning to analyze Seattle bicycle count data and uncover insights about commuting work habits.
Debunks the myth that models can't have more parameters than data points, explaining how and when under-determined models can be solved and useful.
A comparison of Python implementations for the Lomb-Scargle periodogram, recommending the fast algorithm in the gatspy package for analyzing irregularly-sampled data.
A guide to optimizing a non-trivial algorithm (NUFFT) in Python using NumPy and Numba, comparing performance to a Fortran implementation.
An interactive exploration using IPython to simulate and understand the mathematical model behind 'The Hipster Effect' paper on conformity and non-conformity.
A critique of the 'jet' colormap in data visualization, with a Python function to convert colormaps to grayscale for analysis.