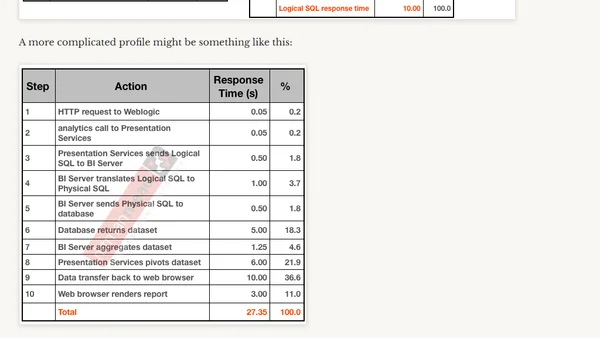
Performance and OBIEE - part VI - Analysing results
Part VI of an OBIEE performance series focusing on analyzing test results, avoiding averages, and using percentiles for accurate diagnosis.
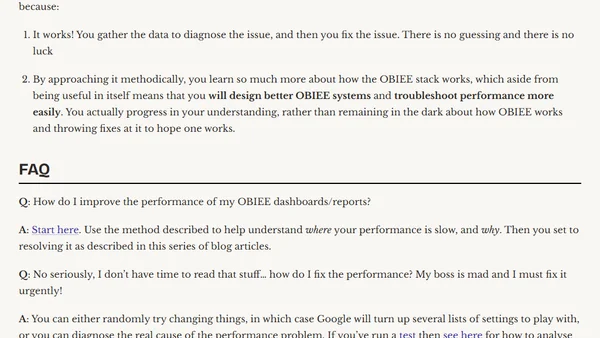
A summary and FAQ on a methodical approach to diagnosing and optimizing performance in OBIEE (Oracle Business Intelligence Enterprise Edition).
A critique of a New York Times article's explanation of p-values, clarifying common statistical misinterpretations for a non-technical audience.
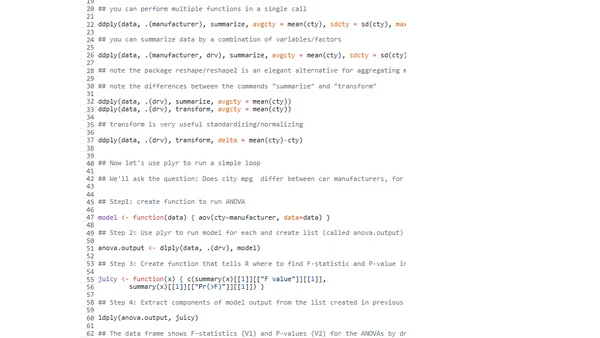
A presentation and tutorial on using the `plyr` package in R for data manipulation, summarization, and automated statistical analysis.
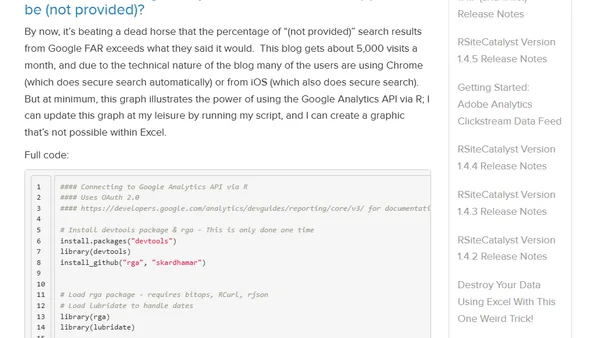
A tutorial on using R and the Google Analytics API to analyze and visualize '(not provided)' organic search data.
A tutorial video demonstrating how to execute SQL queries within the R programming language using the 'sqldf' package for data analysis.
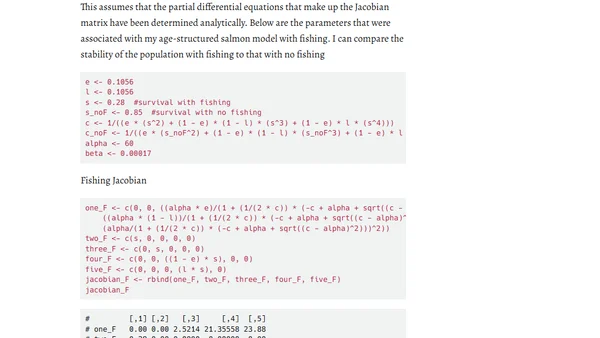
A technical presentation on using R to create and analyze stochastic, age-structured matrix population models for ecological simulations.
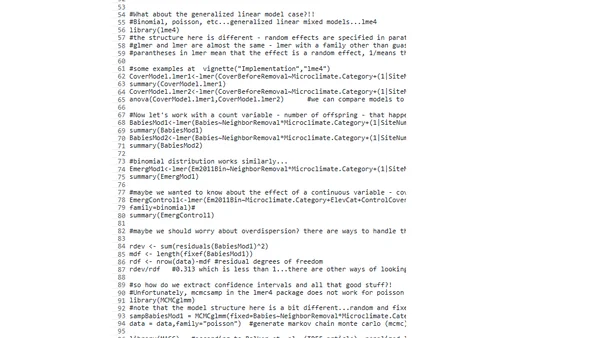
A tutorial introduction to using mixed models in R for statistical analysis, covering linear and generalized linear mixed models with code examples.
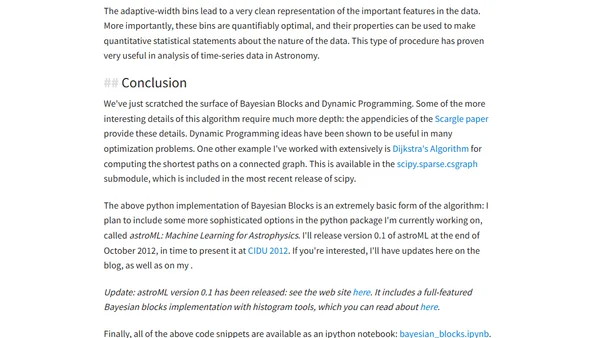
Explores dynamic programming in Python through Bayesian Blocks, a method for creating adaptive histograms with optimal bin sizes.
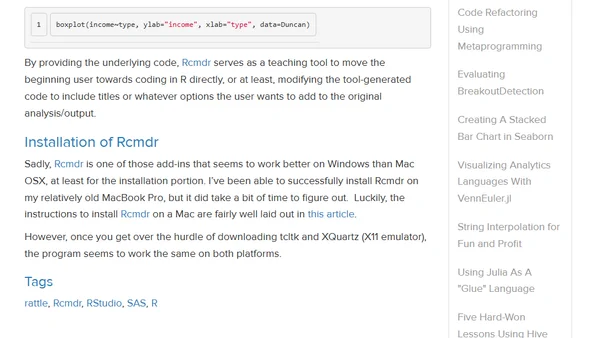
Introduces Rcmdr, a GUI for performing basic business statistics in R without coding, and explains its installation and usage.
An introduction to RStudio, an open-source IDE that enhances the R programming experience with a more user-friendly interface and features.
A retrospective on learning R vs. SAS, highlighting initial frustrations with R's complexity and package management compared to SAS's structured approach.
A first look at Adobe Discover 3, analyzing its new dark interface, improved calendar, heterogeneous pathing, and table builder features for web analytics.
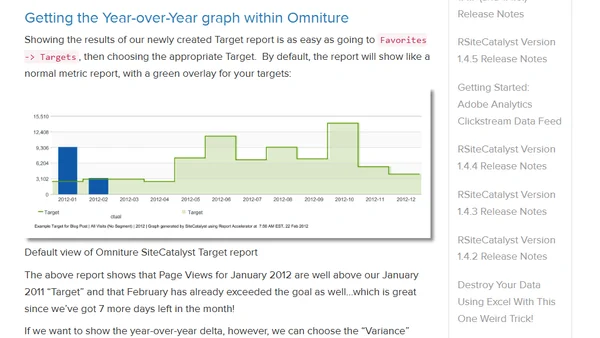
A guide on using Adobe SiteCatalyst's Target report to calculate and visualize year-over-year growth metrics like page views.
A guide on converting UNIX timestamps to readable Excel dates using a simple formula, useful for analyzing log file data.
Explores the crucial distinction between raw information and applied knowledge, especially within Information Systems and data management.
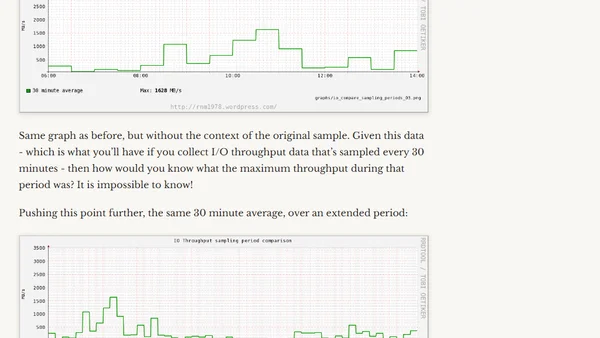
Explains how sampling frequency affects I/O throughput data accuracy in Oracle performance analysis, using a humorous analogy.
Argues against relying on human reasoning for decisions, advocating for data-driven, scientific approaches like experimentation in tech and business.
Explores strategies for motivating users on social sites, moving beyond automated rules to social nudging and community-driven encouragement.
A developer explores the idea of using social graphs to find interests and people completely unrelated to their own profile.