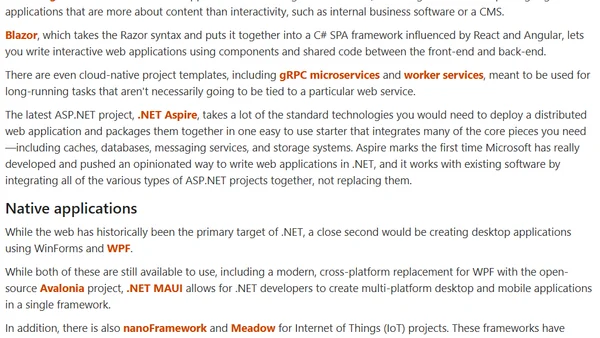
C# and .NET for the Modern Developer
Explores the evolution of C# and .NET, debunking myths and highlighting their modern, cross-platform capabilities for software development.

Explores the evolution of C# and .NET, debunking myths and highlighting their modern, cross-platform capabilities for software development.
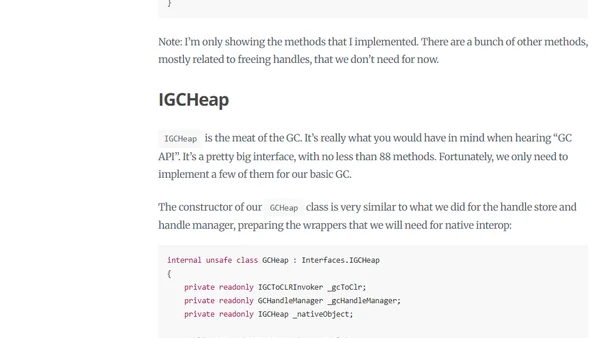
Part 2 of implementing a simple .NET garbage collector in C#, covering native interfaces and a basic handle store.
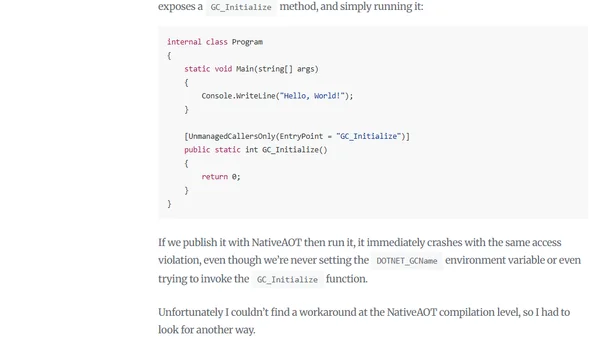
A technical exploration of writing a custom Garbage Collector for .NET in C# using NativeAOT, focusing on the initial setup and API.
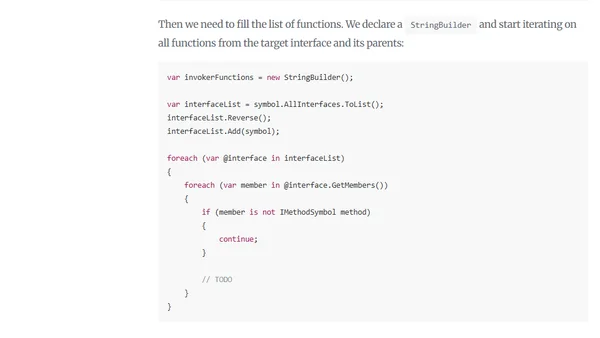
Explains how to write a .NET profiler in C# by implementing ICorProfilerInfo to call native methods from a managed wrapper.
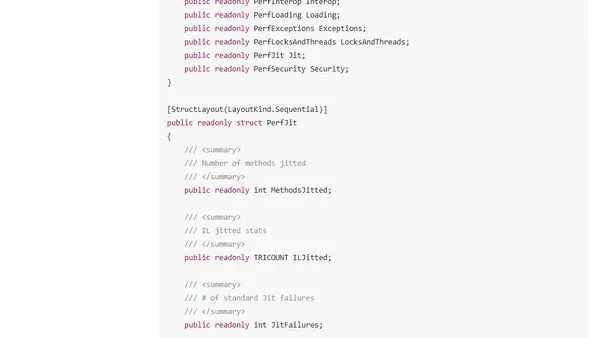
Explains the risks of using .NET performance counters and how to read them directly from the registry for reliability.
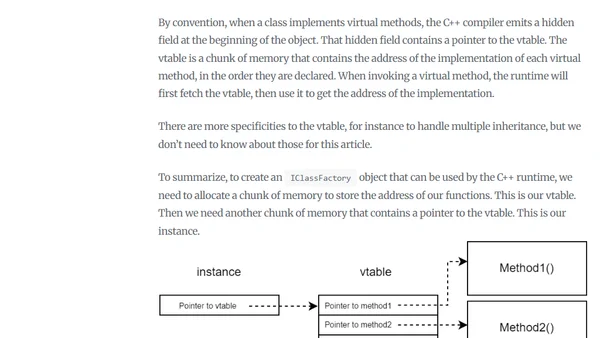
Explores writing a .NET profiler in C# using NativeAOT to overcome traditional C++ limitations and self-profiling issues.
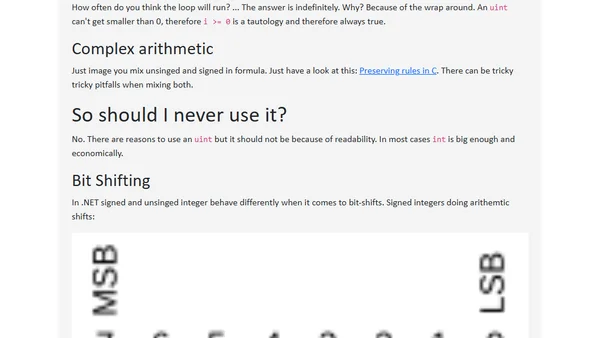
Discusses the pros and cons of using unsigned integers (uint) in C#, covering CLS compliance, wrap-around risks, and practical use cases.
Analyzes the performance cost of exceptions in .NET, showing how they slow down loops and offering optimization advice.
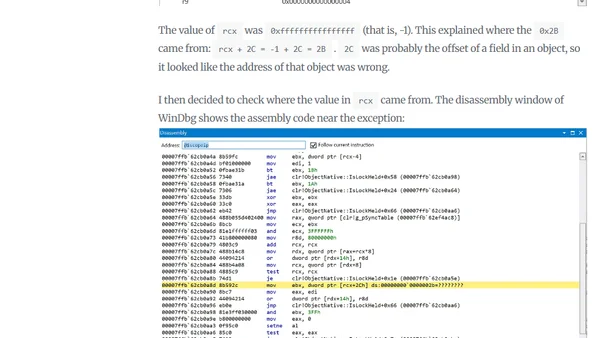
A deep-dive investigation into an AccessViolation crash in the .NET runtime's ObjectNative::IsLockHeld method, encountered while testing a tracer.
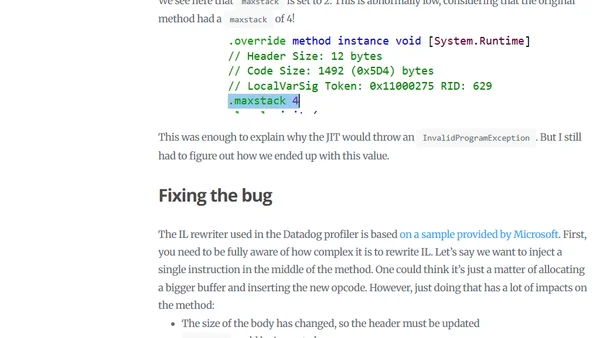
Final part of debugging an InvalidProgramException caused by a profiler bug, focusing on analyzing faulty IL code from a memory dump.
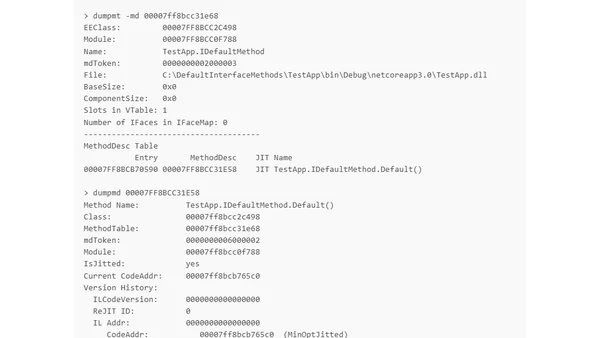
A deep technical dive into how Default Interface Methods (DIM) work under the hood in C# 8 and the .NET Core Runtime.
A curated list of academic research papers that use the .NET Common Language Runtime (CLR) as a case study or foundation for analysis.
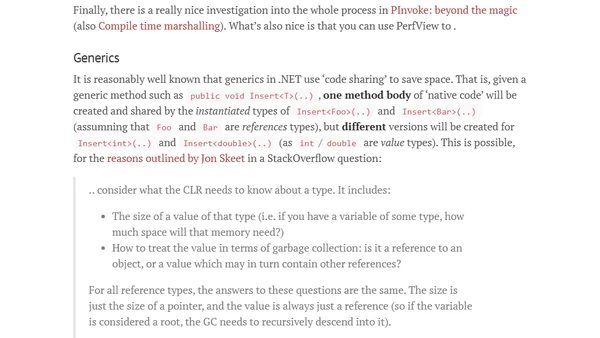
Explains the role and implementation of 'stubs' or 'thunks' within the .NET Runtime, detailing their purpose in method dispatch and indirection.
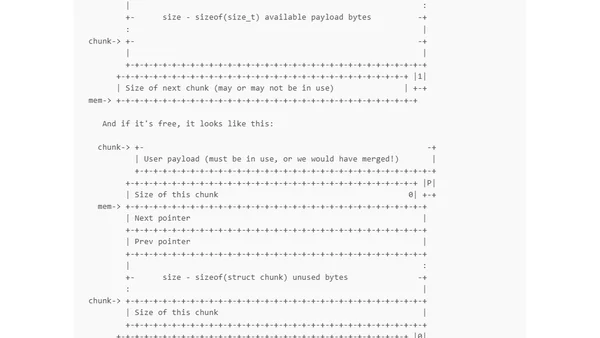
An exploration of ASCII art found in comments within major .NET open-source repositories, categorized by technical themes.
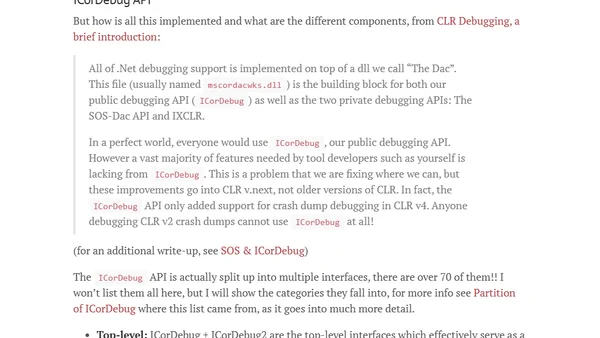
Explores the monitoring, observability, and diagnostic features built into the .NET runtime, including ETW events, profiling, and debugging tools.
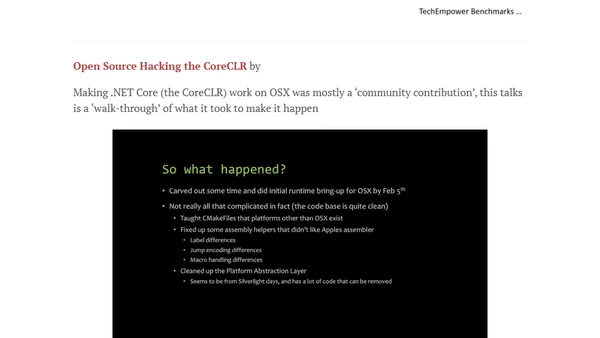
A curated list of presentations and talks that dive deep into the internal workings of the .NET Runtime, including garbage collection, JIT, and performance analysis.
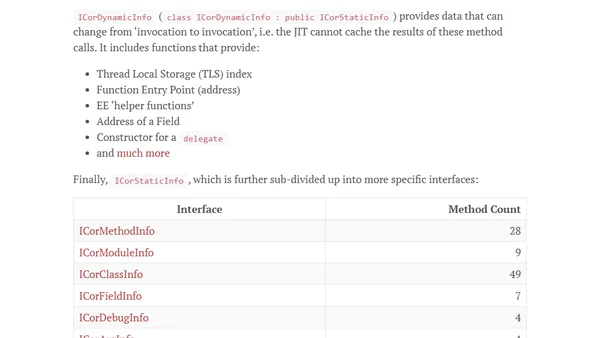
Explores the intricate, interdependent relationship between the .NET CLR (Common Language Runtime) and its JIT (Just-In-Time) compiler.
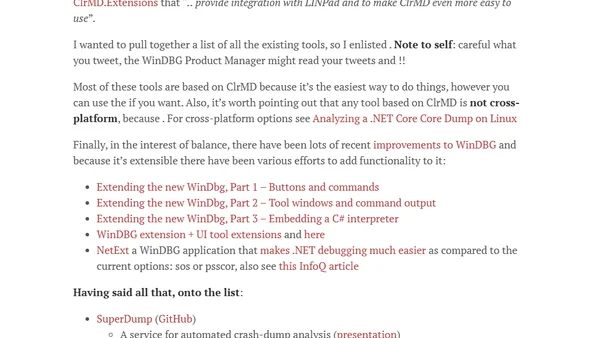
An overview of open-source tools like PerfView and SharpLab for developers to analyze and understand the internal workings of the .NET runtime and CLR.
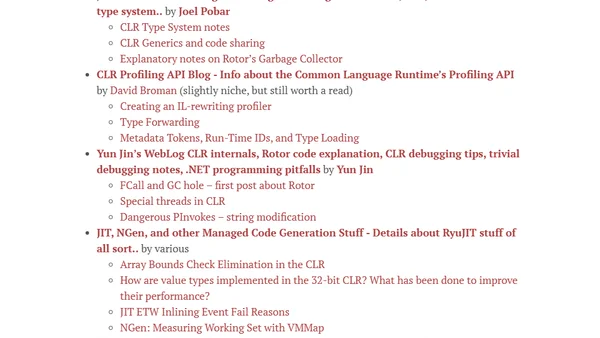
A curated list of blogs and resources for developers to learn about the low-level internals and performance of the .NET runtime and CLR.

A .NET developer's 2017 blog retrospective, analyzing traffic stats, top posts about CLR internals, and the impact of Hacker News.