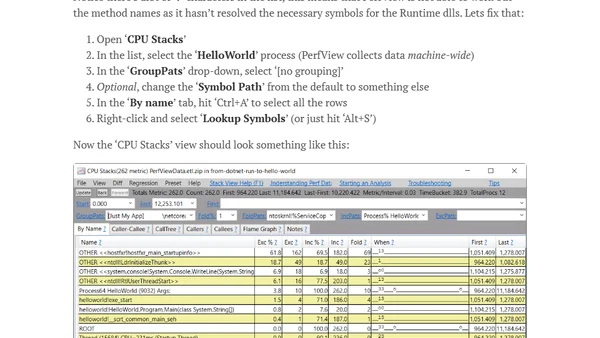
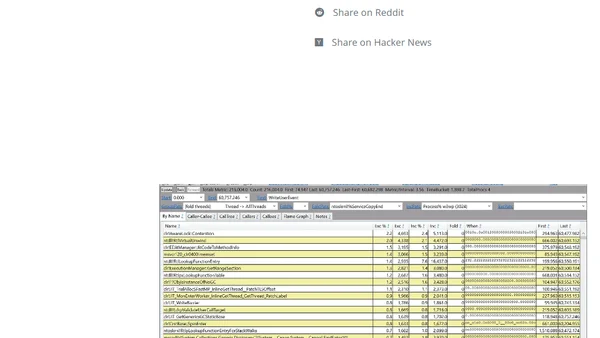
Showing unresolved functions in PerfView
How to disable PerfView's grouping of unresolved CPU frames under '?!?' to better analyze performance bottlenecks.
A step-by-step guide to analyzing .NET application start-up performance using PerfView and flamegraphs.
Guide to profiling .NET applications using PerfView and visualizing the results with the speedscope.app web-based performance viewer.
A .NET performance engineer details using BenchmarkDotNet and PerfView to analyze and optimize a real-world ML.NET benchmark.
An overview of open-source tools like PerfView and SharpLab for developers to analyze and understand the internal workings of the .NET runtime and CLR.