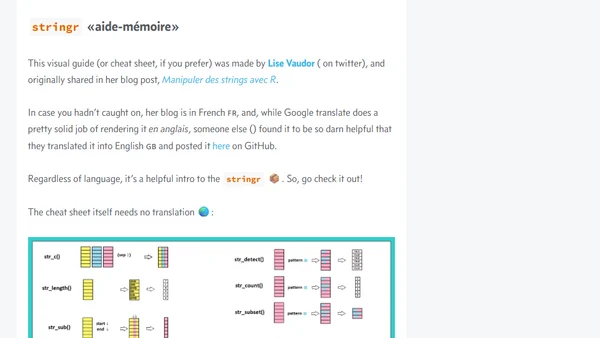
Stringr Visual Cheat Sheet
A visual cheat sheet for the stringr package in R, originally created in French and translated to English, for string manipulation tasks.

Announcing a public lecture series honoring statistician Ross Ihaka, featuring talks on statistical computing, data visualization, and data journalism.
A developer explains their Twitter bot that monitors and visualizes Auckland bus delays using GTFS data and R packages.
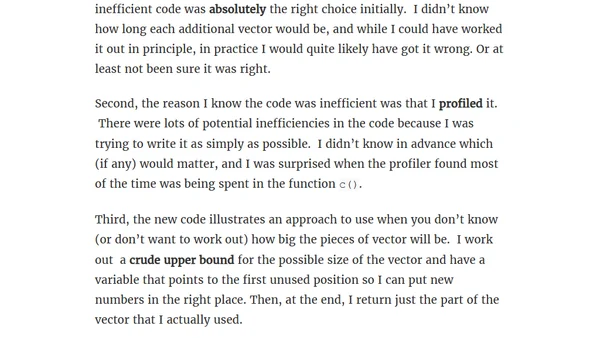
A developer discusses the trade-offs between writing simple, clear code and optimizing for performance, using a real-world example of inefficient vector growth in R.
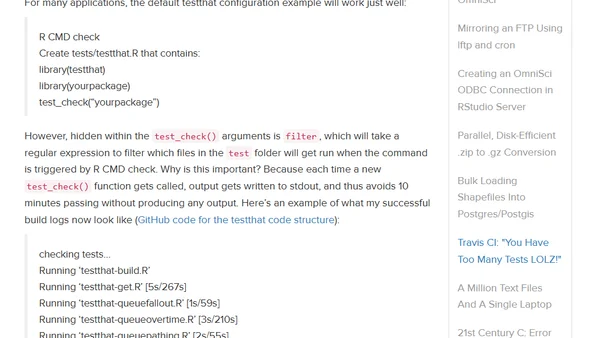
A developer solves Travis CI build timeouts by using testthat's filter argument to split R package tests into smaller, faster-running chunks.
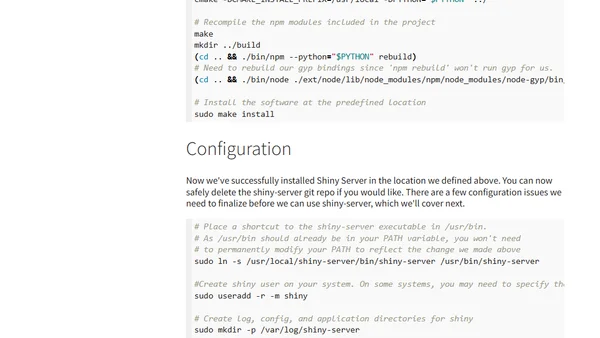
A technical guide on compiling and installing Shiny Server from source on a 32-bit Ubuntu system, including dependency setup and troubleshooting.
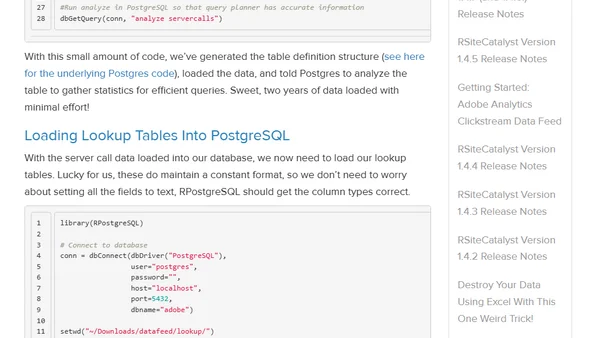
A technical guide on using R and PostgreSQL to load and manage large-scale Adobe Analytics Clickstream Data Feed into a relational database.
Release notes for RSiteCatalyst versions 1.4.6 and 1.4.7, detailing bug fixes and new features for the Adobe Analytics R package.
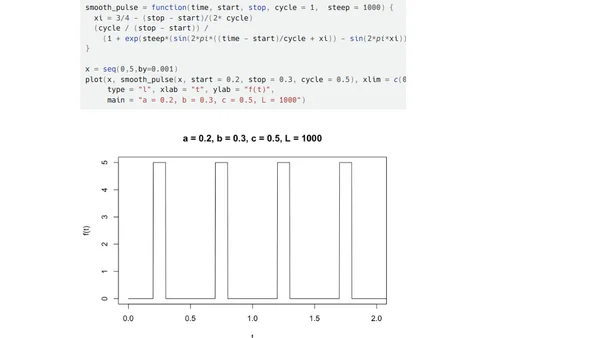
A technical article presenting a mathematical function for creating smooth, differentiable pulses, with R code examples.
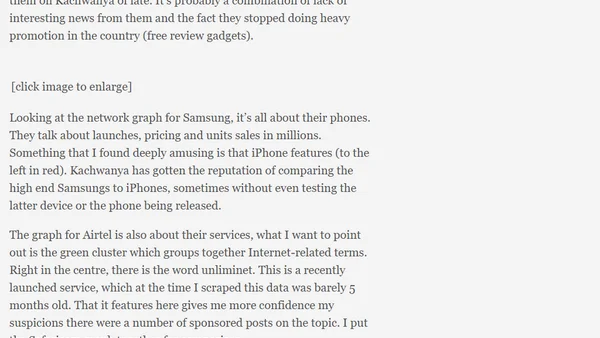
A data-driven critique of a popular Kenyan tech blog, analyzing its content focus using R programming and text mining techniques.
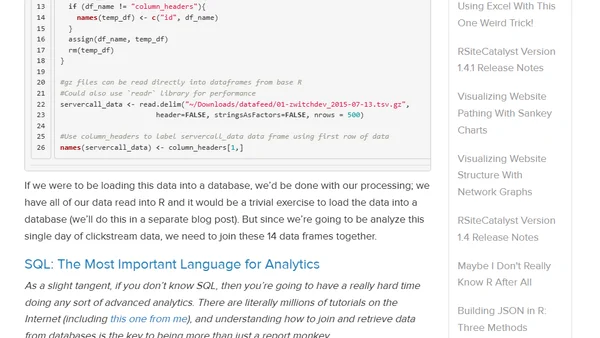
A technical guide on analyzing Adobe Analytics Clickstream Data Feed using R, covering file structure, data verification, and initial processing.
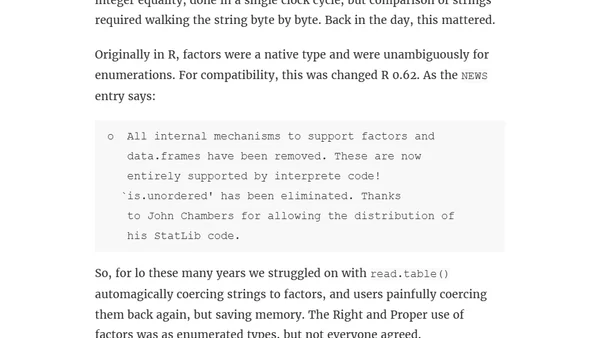
Analyzes the historical and technical reasons behind R's controversial 'stringsAsFactors' default, explaining its origins and the problems it causes.
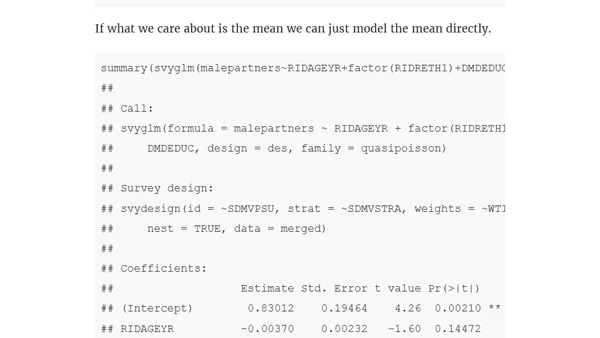
A tutorial on implementing Zero-Inflated Poisson models for complex survey data in R using the survey package.
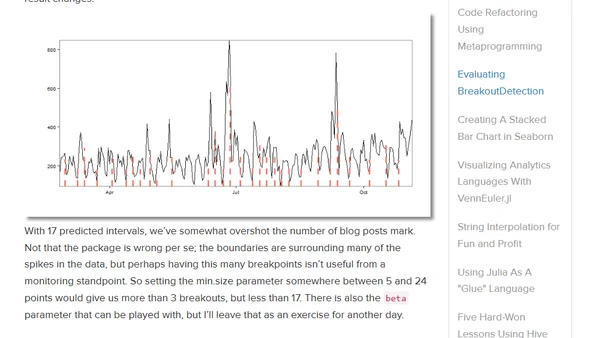
Evaluating Twitter's BreakoutDetection R package for time-series anomaly detection using real blog traffic data.
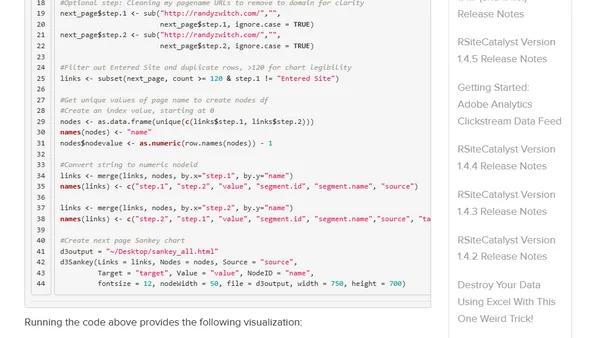
A technical guide on using R, RSiteCatalyst, and d3Network to create Sankey charts for visualizing website visitor pathing data from Adobe Analytics.
Explains why specialized sinpi() functions exist for accurate computation of trigonometric functions at half-integer multiples, avoiding floating-point errors.
Using R to create a Google Calendar with sunset times and travel alerts for a personal viewing spot.
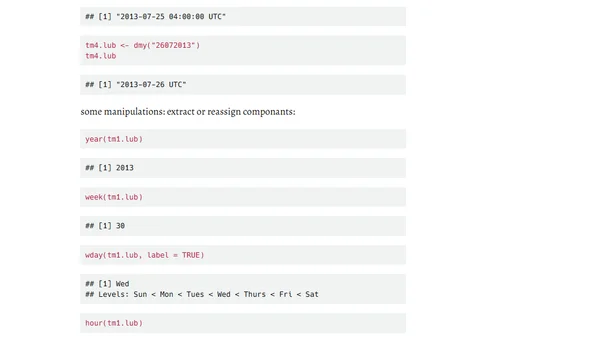
A tutorial on handling dates and times in R, covering essential classes like Date and POSIXct, formatting, calculations, and sequences.
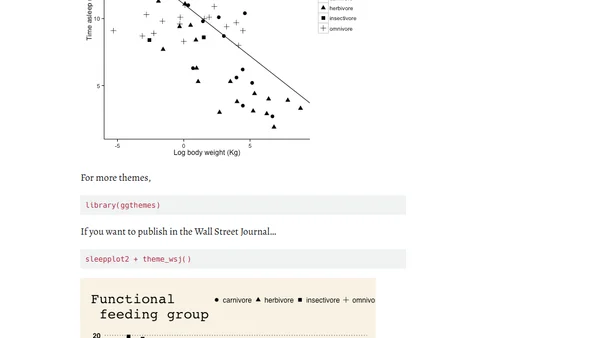
A technical tutorial on formatting ggplot2 plots for scientific publication, including design adjustments and using Inkscape for final edits.
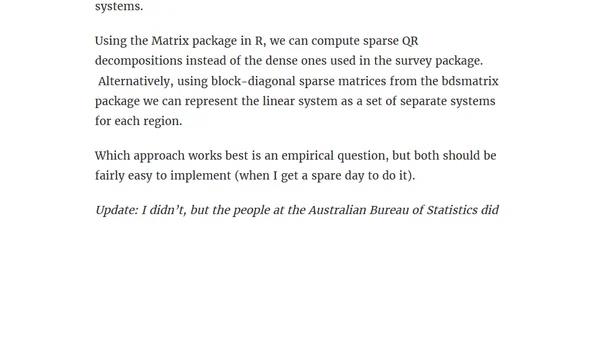
Explores using sparse matrix techniques in R to efficiently calibrate survey weights for large-scale population data.