Don’t use Arrays or other Complex Types in Custom JFR Events
Explains why using arrays and complex types in custom JDK Flight Recorder (JFR) events is problematic and should be avoided.

Explains why using arrays and complex types in custom JDK Flight Recorder (JFR) events is problematic and should be avoided.

Explores an experimental front-end tool for querying Java Flight Recorder (JFR) data using a custom SQL-like language.

Explains JEP 518's new JFR cooperative sampling for unbiased stack walking at safepoints in the JVM, targeting JDK 25.
A guide on generating and analyzing CPU profiles for Nuxt.js applications to debug bundling performance using Node.js flags.
A developer reflects on unfinished tech projects, including profiling JavaScript apps and analyzing fast HTTP router strategies.
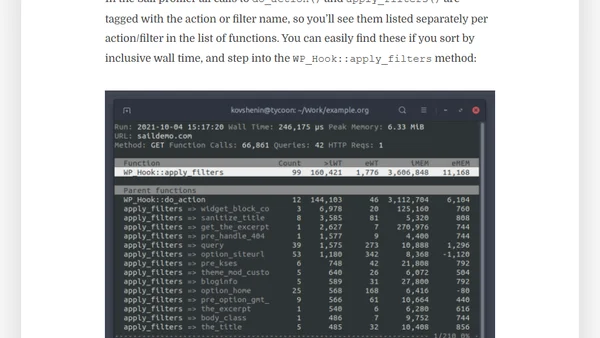
A guide to using Sail CLI for performance profiling of WordPress sites, analyzing PHP functions, database queries, and actions/filters.
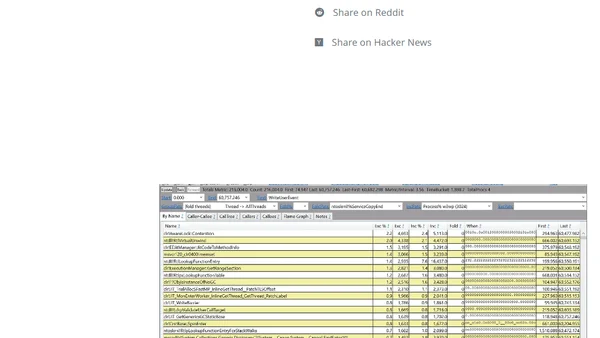
How to disable PerfView's grouping of unresolved CPU frames under '?!?' to better analyze performance bottlenecks.
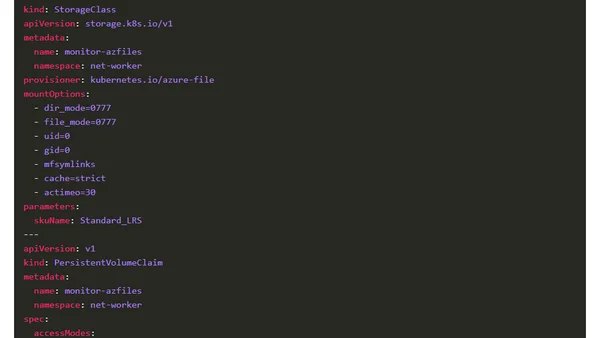
A guide to using .NET Core diagnostics tools in a sidecar container to trace and profile applications running on Azure Kubernetes Service.
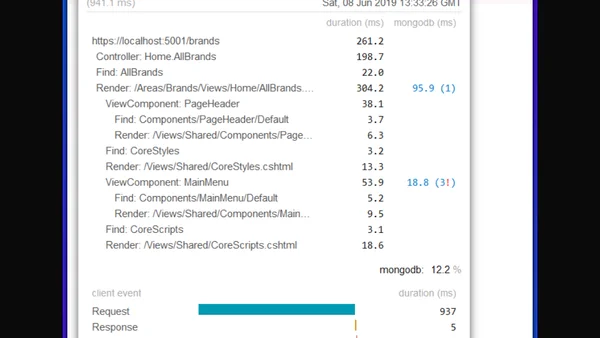
A guide to integrating MiniProfiler with MongoDB in .NET using the MongoFramework wrapper library for performance profiling.
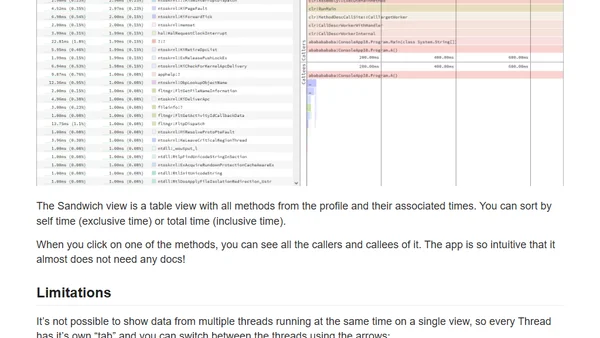
Guide to profiling .NET applications using PerfView and visualizing the results with the speedscope.app web-based performance viewer.
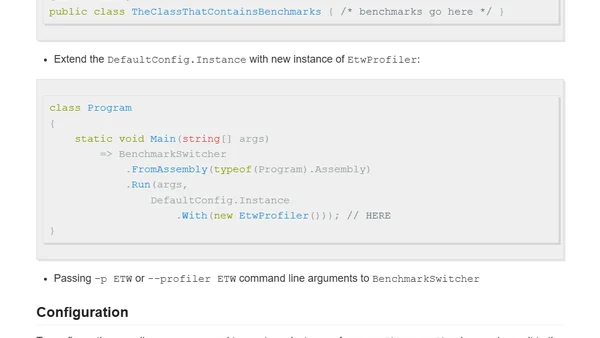
Introducing EtwProfiler, a new BenchmarkDotNet diagnoser for profiling .NET code on Windows and exporting trace data for analysis.
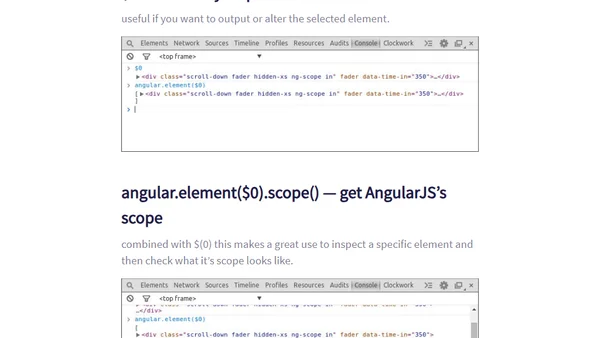
Learn four powerful commands for Chrome DevTools to debug, inspect elements, profile performance, and work with AngularJS scopes.
A guide to using MiniProfiler for performance profiling and identifying bottlenecks in ASP.NET MVC applications, focusing on database queries and server-side timing.
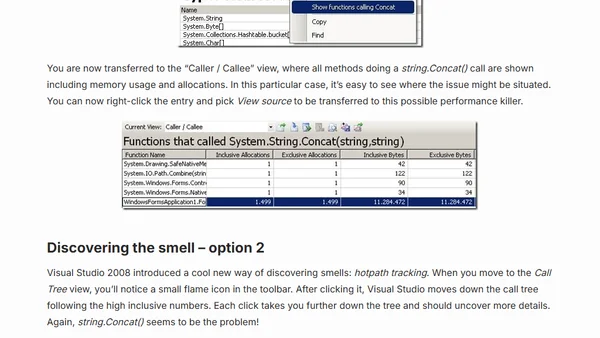
A tutorial on using Visual Studio 2008's built-in performance profiling tool to identify and analyze a memory issue in C# code.