Profiling .NET Code with BenchmarkDotNet
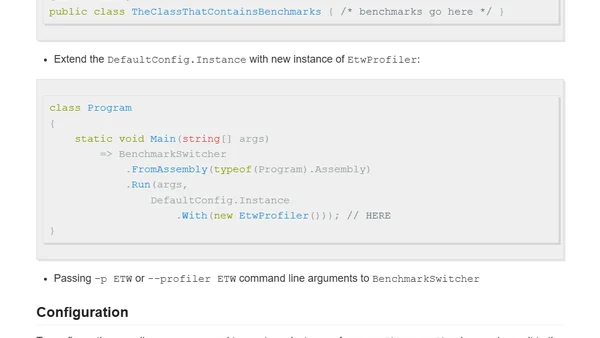
Read OriginalThis article details the new EtwProfiler diagnoser for BenchmarkDotNet, which allows developers to profile .NET code on Windows using ETW and export data to trace files for tools like PerfView. It includes a real-world benchmark example from ML.NET and explains the tool's implementation and benefits for performance analysis.
Comments
No comments yet
Be the first to share your thoughts!
Browser Extension
Get instant access to AllDevBlogs from your browser
Top of the Week
1
2
Using Browser Apis In React Practical Guide
Jivbcoop
•
2 votes
3
Better react-hook-form Smart Form Components
Maarten Hus
•
2 votes
4
Top picks — 2026 January
Paweł Grzybek
•
1 votes
5
In Praise of –dry-run
Henrik Warne
•
1 votes
6
Deep Learning is Powerful Because It Makes Hard Things Easy - Reflections 10 Years On
Ferenc Huszár
•
1 votes
7
Vibe coding your first iOS app
William Denniss
•
1 votes
8
AGI, ASI, A*I – Do we have all we need to get there?
John D. Cook
•
1 votes
9
Quoting Thariq Shihipar
Simon Willison
•
1 votes
10
Dew Drop – January 15, 2026 (#4583)
Alvin Ashcraft
•
1 votes