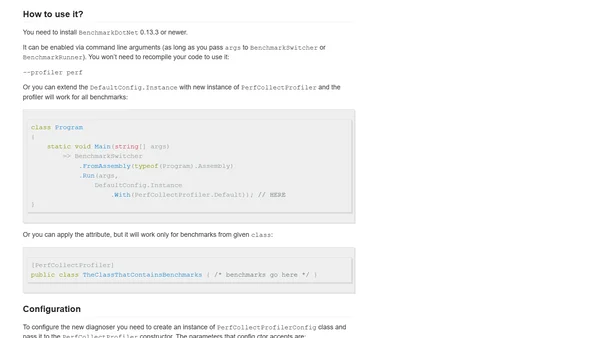
Profiling .NET on Linux with BenchmarkDotNet
Introduces PerfCollectProfiler, a BenchmarkDotNet plugin for profiling .NET applications on Linux and exporting trace data for performance analysis.
Adam Sitnik is a Microsoft .NET engineer specializing in performance, reliability, and open-source contributions.
10 articles from this blog
Introduces PerfCollectProfiler, a BenchmarkDotNet plugin for profiling .NET applications on Linux and exporting trace data for performance analysis.
Guide to profiling .NET applications using PerfView and visualizing the results with the speedscope.app web-based performance viewer.
A guide to profiling concurrent .NET applications using BenchmarkDotNet's ConcurrencyVisualizerProfiler and visualizing the results in Visual Studio.
A .NET performance engineer details using BenchmarkDotNet and PerfView to analyze and optimize a real-world ML.NET benchmark.
Introducing EtwProfiler, a new BenchmarkDotNet diagnoser for profiling .NET code on Windows and exporting trace data for analysis.
A software developer shares their personal approach and evolving philosophy for conducting technical interviews, focusing on preparation, reducing candidate stress, and assessing practical skills.
Introducing the Disassembly Diagnoser for BenchmarkDotNet, a tool to disassemble .NET code to ASM, IL, and C# for performance analysis.
Explains the Span<T> type in C# for safe, high-performance memory manipulation across stack, unmanaged, and managed memory.
Explains C# 7.0's ref returns and ref locals for passing and returning large structs by reference to improve performance.
Explains the performance differences between value types and reference types in .NET, focusing on memory layout, CPU cache, and garbage collection.