Profiling .NET Code with PerfView and visualizing it with speedscope.app
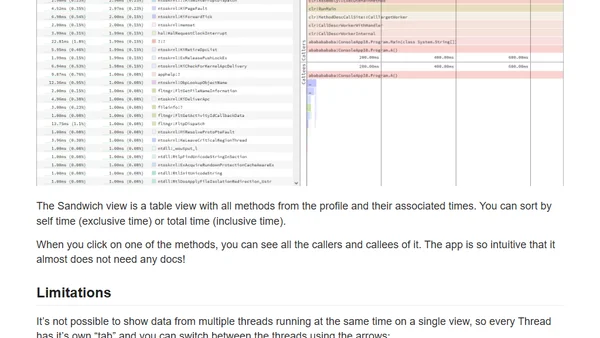
Read OriginalThis technical article explains how to profile .NET code using PerfView and export the trace data to visualize it with speedscope.app, a web-based performance profile viewer. It details the implementation of the SpeedScopeExporter in the TraceEvent library, the workflow for exporting from PerfView, and the benefits of using speedscope.app for analyzing flame graphs and performance data locally in the browser.

Comments
No comments yet
Be the first to share your thoughts!
Browser Extension
Get instant access to AllDevBlogs from your browser
Top of the Week
No top articles yet