These 3 alerts catch the most issues
A software engineer shares three highly effective production alerts for catching bugs and system issues, based on real-world experience.

A software engineer shares three highly effective production alerts for catching bugs and system issues, based on real-world experience.
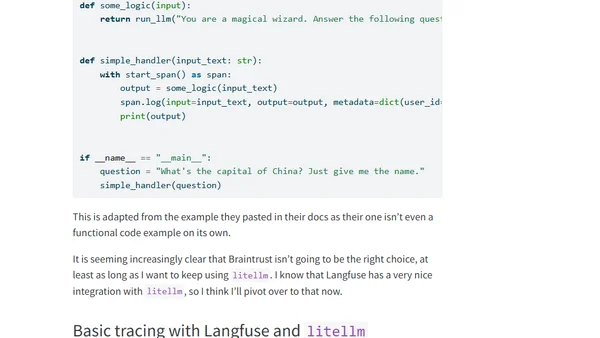
A developer's technical walkthrough of instrumenting LLM tracing for litellm using Braintrust and Langfuse, detailing setup and challenges.
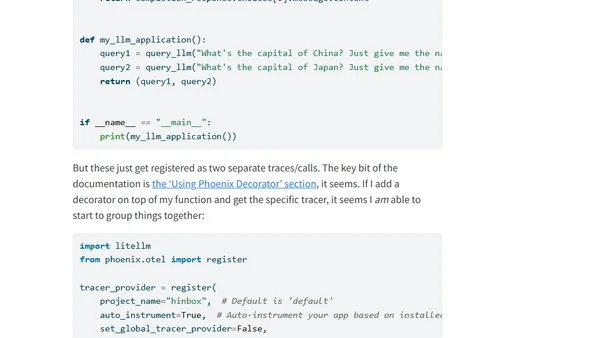
A technical guide on instrumenting AI agentic applications using Arize Phoenix and litellm for observability and trace grouping.
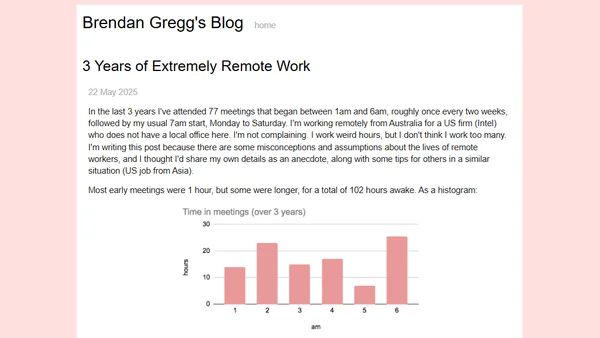
An engineer shares his 3-year experience of working remotely from Australia for a US firm, detailing the challenges of extreme timezone differences.
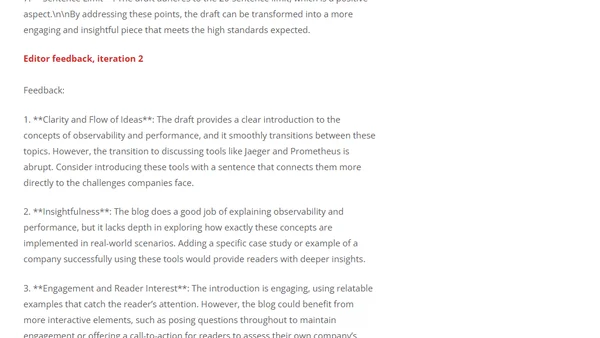
Explores the synergy between observability and performance in modern software, highlighting tools like Jaeger and Prometheus for microservices.
A tech founder reflects on using Twitter for technical discourse, product development, and personal motivation, while acknowledging its addictive nature.
A critique of the "Observability 3.0" label and a discussion on the evolution from multi-pillar to unified storage models in software telemetry.
A guide to help large organizations decide whether to use Datadog's multi-org feature, covering key factors like company structure, data correlation, and cost.
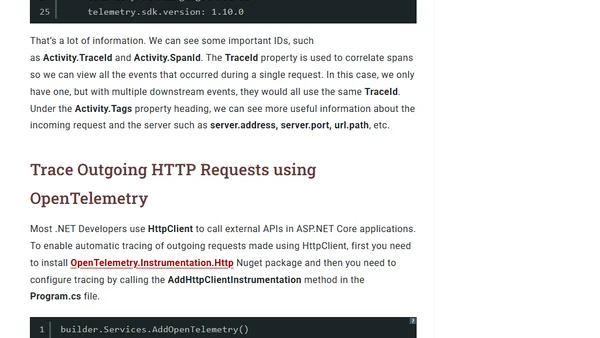
A guide to implementing OpenTelemetry for distributed tracing in ASP.NET Core applications to improve observability and performance.
A critique of semantic versioning in observability marketing, arguing that terms like 'Observability 2.0' describe a real technical shift despite overuse.
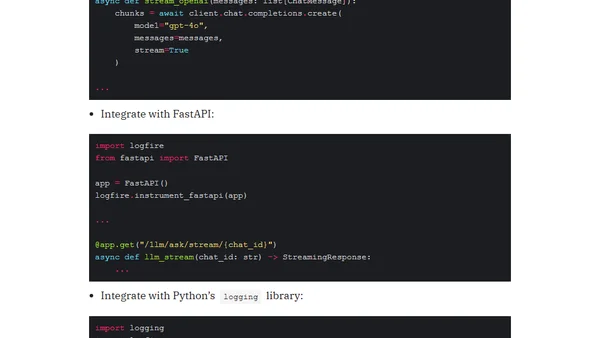
Introducing Logfire, Pydantic's new observability tool for Python, with easy integration for OpenAI LLM calls, FastAPI, and logging.
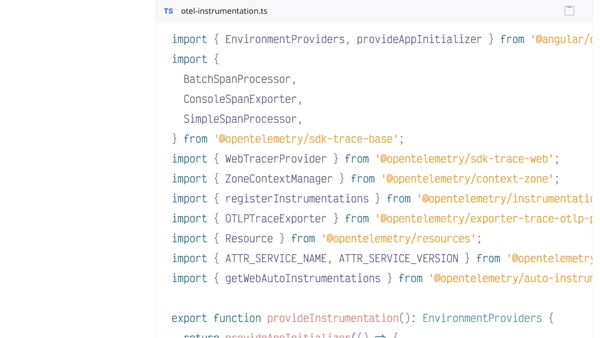
Guide to sending OpenTelemetry traces from an Angular frontend to a .NET Aspire backend for unified observability in the Aspire Dashboard.
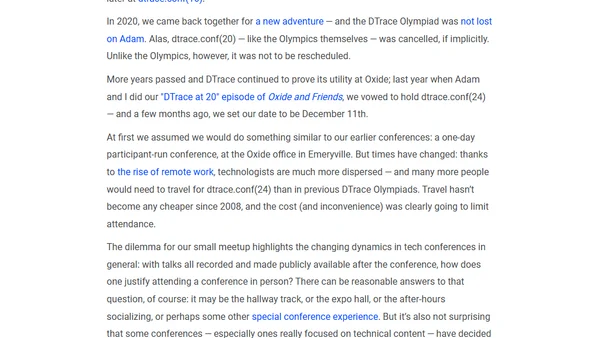
A history of the dtrace.conf conference, from its origins as a small 2008 meetup to its evolution into a recurring event for the DTrace community.

Explains the core technical shift from multi-tool Observability 1.0 to a unified, event-based Observability 2.0.
The article argues for versioning observability concepts, distinguishing between traditional 'three pillars' (1.0) and modern event-based (2.0) approaches.
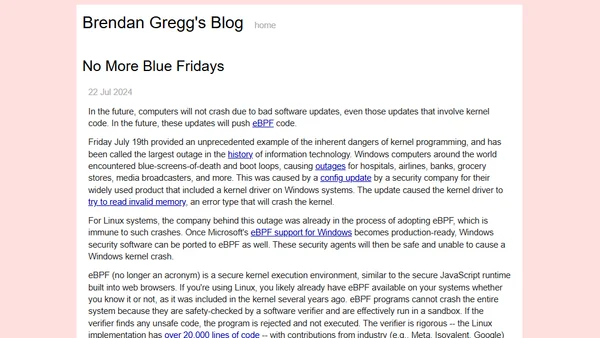
How eBPF technology can prevent system crashes like the massive July 2024 Windows outage caused by a faulty kernel driver update.
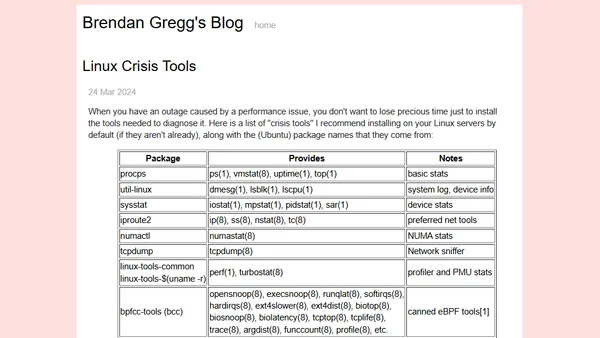
A list of essential Linux tools to pre-install for diagnosing performance issues and outages, including package names.
Blog post about the new eBPF documentary, which tells the story of how the revolutionary Linux kernel technology was developed and accepted.
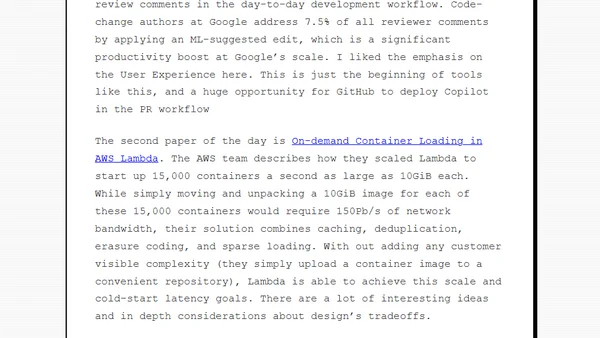
A monthly tech digest covering Meta's DotSlash tool, AI-powered code reviews, AWS Lambda scaling, observability trends, and Cloudflare's logging pipeline.
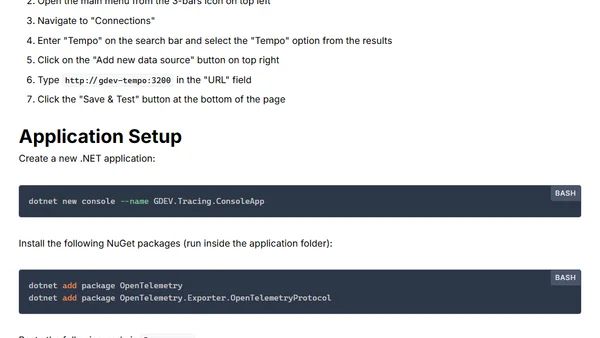
A guide to setting up distributed tracing for C# applications using Grafana and Tempo, including infrastructure configuration and integration.