Measuring UI responsiveness in Resharper
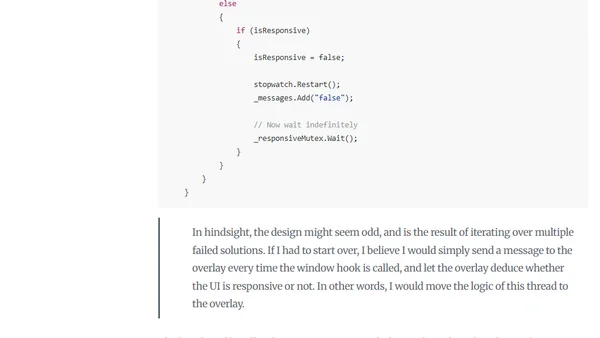
Read OriginalThe article explains the author's work at JetBrains to improve ReSharper's performance, focusing on UI responsiveness and startup time. It details the creation of a custom .NET profiling tool called Silhouette and a real-time WPF overlay to visually measure input latency, moving beyond standard ETW methods to detect sub-250ms pauses for a smoother IDE experience.
0 comments
Comments
No comments yet
Be the first to share your thoughts!
Browser Extension
Get instant access to AllDevBlogs from your browser
Top of the Week
No top articles yet