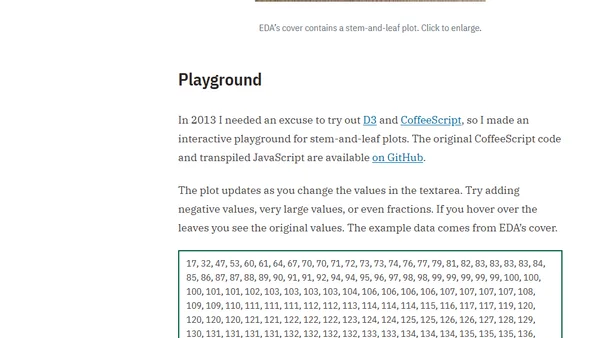
Stem-and-Leaf Plot Playground
A blog post reviving an interactive stem-and-leaf plot playground built with D3 and CoffeeScript, demonstrating data visualization techniques.
A tutorial on creating customizable heat maps in R using the gplots and RColorBrewer packages for data visualization.
A tutorial on creating customizable heat maps in R using the gplots package, covering installation, data preparation, and plot customization.
A guide to using the Unix command-line for efficient data science workflows, including data processing, exploration, and modeling.