Viewing Argo’s Prometheus metrics in a kind cluster
A technical guide on configuring Argo workflows to expose Prometheus metrics within a local Kubernetes cluster created using kind.
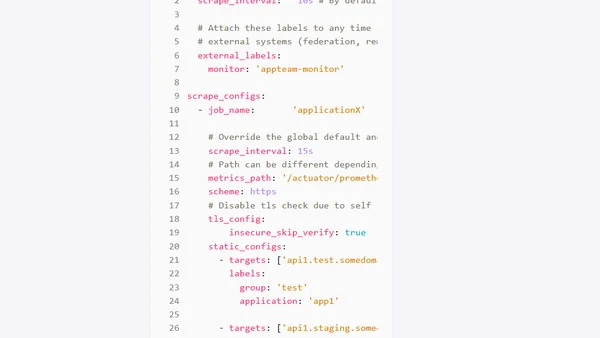
A guide on implementing application monitoring for Spring Boot using Micrometer, Prometheus, and Grafana for internal metrics.
Gnocchi 4.2 release introduces new InfluxDB/Prometheus compatibility endpoints, ACL improvements, and performance enhancements for the time series database.
Explores solutions for monitoring multi-process Python applications with Prometheus, addressing metric inconsistency across workers.
A technical comparison of two open-source time series databases, Gnocchi and Prometheus, focusing on their features, architectures, and use cases.
An overview of Prometheus for application metrics, covering its architecture, query language, and monitoring philosophy.