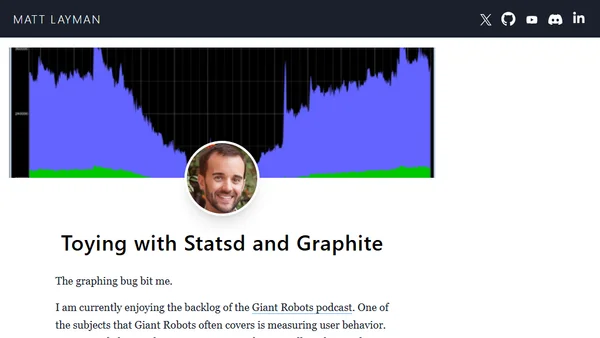
Installing obi-metrics-agent, Graphite, and collectl
Guide to installing obi-metrics-agent, Graphite, and collectl for monitoring OBIEE and system metrics on Linux.
Introduces obi-metrics-agent, an open-source Python tool for collecting and monitoring OBIEE performance metrics from DMS.
Guide on using OBIEE Usage Tracking data to set up performance monitoring and alerts within Oracle Enterprise Manager 12c (EM12c).
Explains how to access and gather CPU, memory, I/O, and network usage metrics from Linux control groups (cgroups) for LXC and Docker containers.
The first milestone of OpenStack Ceilometer's Havana development branch is released, featuring new metrics, alarm APIs, and backend improvements.
A review of the book 'Instant Munin Plugin Starter', covering its practical guide to creating monitoring plugins for the Munin system.
A technical guide on using SQL Server Extended Events for tracing and monitoring Analysis Services (SSAS) performance, replacing SQL Profiler.
A summary and FAQ on a methodical approach to diagnosing and optimizing performance in OBIEE (Oracle Business Intelligence Enterprise Edition).
Analysis of Synaps, Samsung's open-source CloudWatch API implementation for OpenStack, comparing it to projects like Ceilometer and Heat.
A guide to creating custom Nagios plugins for advanced monitoring of the OBIEE (Oracle Business Intelligence) technology stack.
A technical guide on implementing automated monitoring for OBIEE using the Nagios Core open-source systems management tool.
Announcing PyMuninCli, a new Python client library for querying Munin monitoring servers.
A guide to creating a custom plugin for Spring Insight to monitor and analyze performance of Hippo CMS HST queries using AspectJ.
Explains how to instrument OBIEE database connections for improved performance diagnostics and user session tracking.
Explains the importance of defining CLIENT_ID in OBIEE for user query tracking and troubleshooting database calls.
Introducing Glimpse for PHP, a client-side debugging tool that provides insights into server-side operations, similar to Firebug for the client.
A technical guide on integrating custom OBIEE performance monitoring graphs into Oracle Application Server (OAS) using Apache configuration.
A technical guide on using gnuplot to visualize OBIEE performance monitoring data captured from JMX metrics.
A technical guide on using JMX and jmxsh to monitor and collect performance data from OBIEE (Oracle Business Intelligence) systems.
A technical guide on monitoring OBIEE systems using JMX, shell scripting, and gnuplot for metrics collection and real-time graphing.