Using Gnocchi with Docker
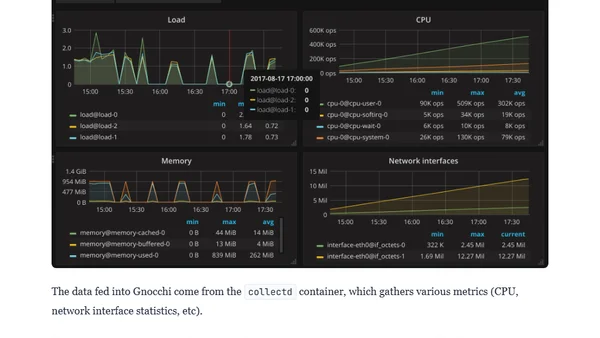
A guide on deploying and using the Gnocchi metrics storage system with Docker, Docker Compose, Grafana, and collectd.
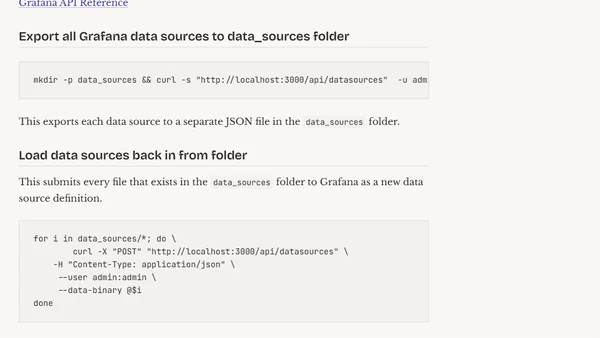
A technical guide for exporting and importing Grafana data sources using curl, jq, and bash scripts.
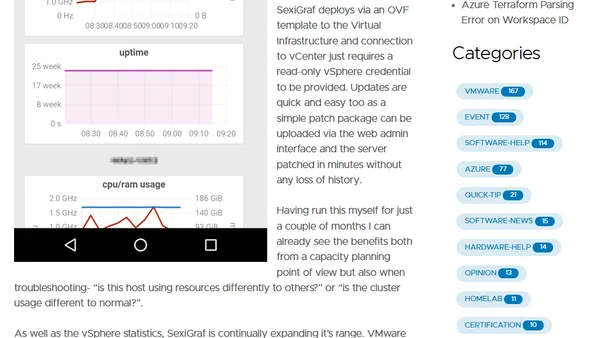
An introduction to SexiGraf, a free community tool for creating visual graphs from vCenter statistics for VMware monitoring.
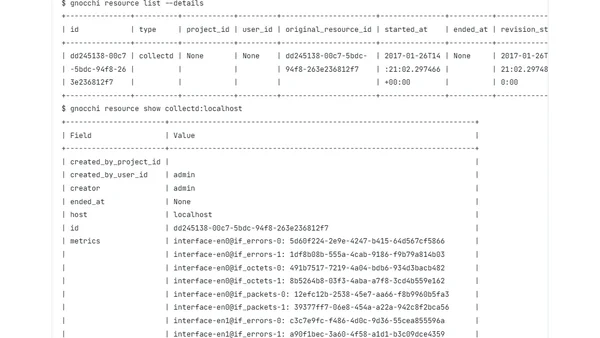
A tutorial on configuring collectd to send system metrics to the Gnocchi time-series database for monitoring and visualization.
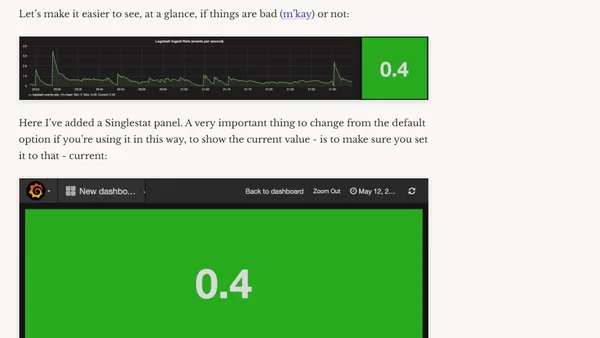
A tutorial on monitoring Logstash data ingest rates using InfluxDB for storage and Grafana for visualization.
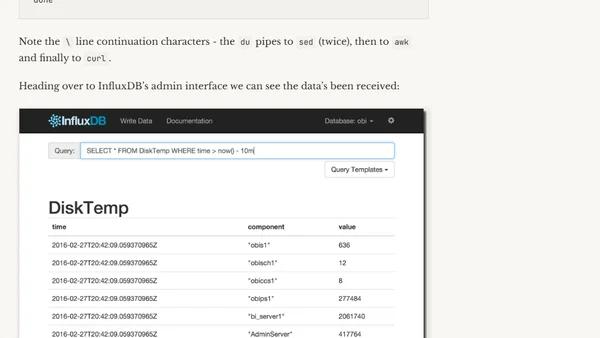
A guide to streaming custom system metrics into InfluxDB using bash commands, sed, awk, and curl for monitoring with tools like Grafana.
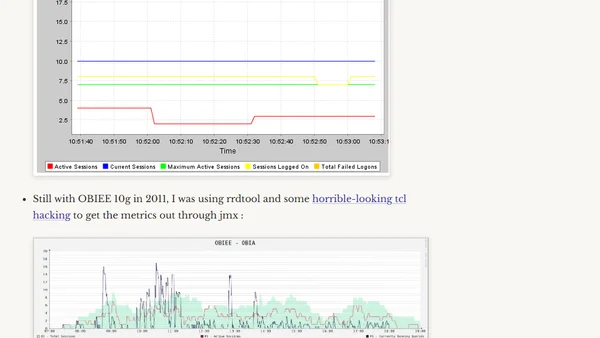
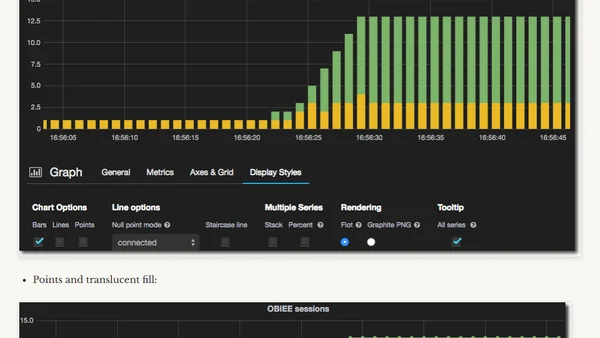
A history of visualizing OBIEE DMS metrics, from early JMX tools to modern Grafana dashboards.
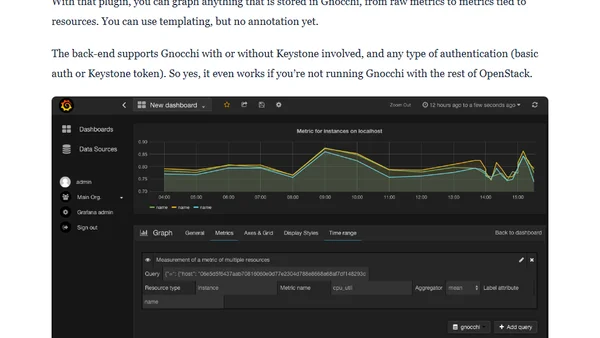
Announcing a Grafana plugin for Gnocchi, enabling visualization of metrics from the OpenStack-compatible time-series database.
Guide to monitoring OBIEE performance using InfluxDB for time-series data and Grafana for visualization dashboards.
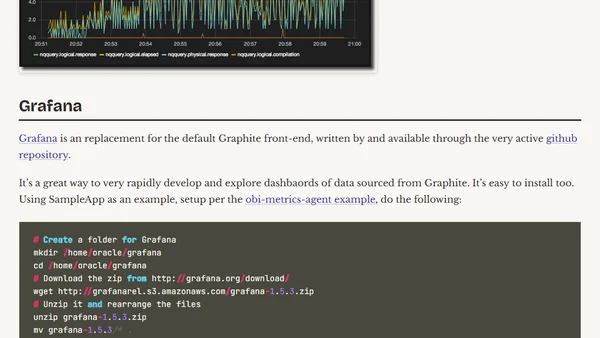
Extends OBIEE performance monitoring by integrating DMS metrics and nqquery.log data into Graphite and visualizing with Grafana.