Monitoring Logstash Ingest Rates with InfluxDB and Grafana
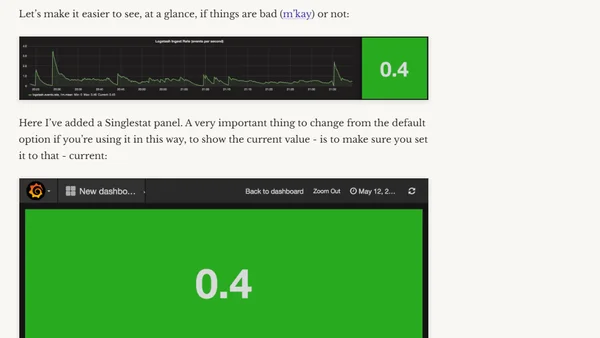
Read OriginalThis technical guide explains how to configure Logstash to track event processing rates using its metric filter, send the data to InfluxDB via the Graphite protocol, and visualize the ingest rates in real-time dashboards using Grafana.

Comments
No comments yet
Be the first to share your thoughts!
Browser Extension
Get instant access to AllDevBlogs from your browser
Top of the Week
No top articles yet