Mapping NZ cases of COVID-19
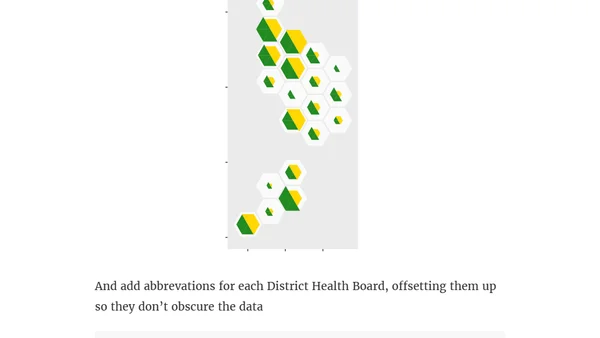
Read OriginalThis article provides a step-by-step technical guide on visualizing New Zealand COVID-19 case data. It details the process of using R, the DHBins package, and ggplot2 to create a split hex map that compares population size and confirmed cases across different District Health Boards.
Comments
No comments yet
Be the first to share your thoughts!
Browser Extension
Get instant access to AllDevBlogs from your browser
Top of the Week
No top articles yet