Best TidyTuesday 2019
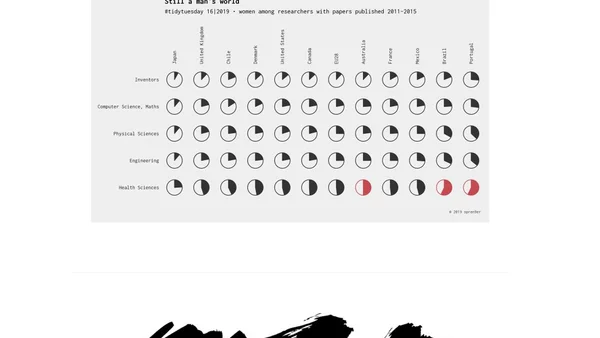
Read OriginalThis article curates and celebrates the most impressive 2019 contributions to the #TidyTuesday data visualization challenge. It highlights standout submissions from various participants, focusing on two key aspects: innovative design (visually pleasing and unusual chart types) and effective storytelling. Examples include Jake Kaupp's flower plot of bird collisions, Georgios Karamanis's artistic ramen ratings, and Torsten Sprenger's network of CRAN packages, showcasing advanced R and ggplot2 techniques.
Comments
No comments yet
Be the first to share your thoughts!
Browser Extension
Get instant access to AllDevBlogs from your browser
Top of the Week
No top articles yet