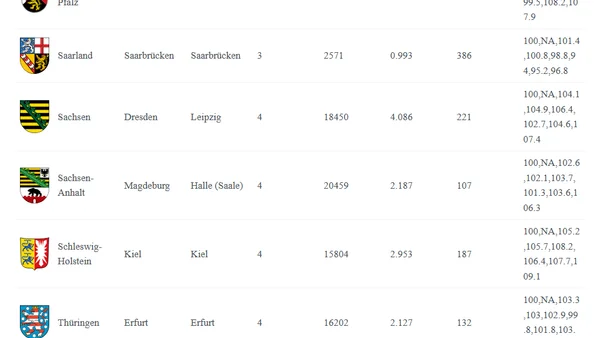
Creating fancy interactive tables using Internet data with rvest and reactable
Read OriginalThis detailed R programming tutorial demonstrates how to build an interactive table displaying German state statistics. It covers web-scraping data from Wikipedia using the {rvest} package, handling locale-specific formatting, and creating a polished, interactive table with the {reactable} and {reactablefmtr} libraries.
Comments
No comments yet
Be the first to share your thoughts!
Browser Extension
Get instant access to AllDevBlogs from your browser
Top of the Week
No top articles yet