Color your own Europe with Clojure!
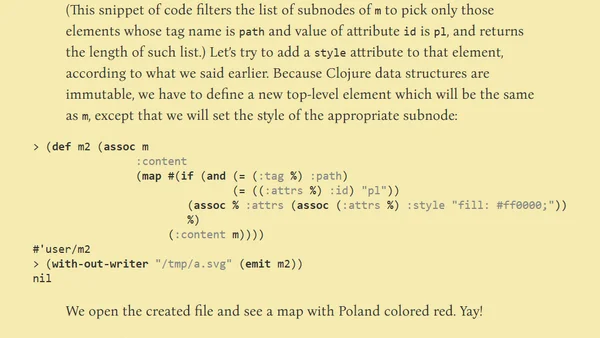
A tutorial on using Clojure to programmatically color SVG maps of Europe, demonstrating XML parsing and manipulation.
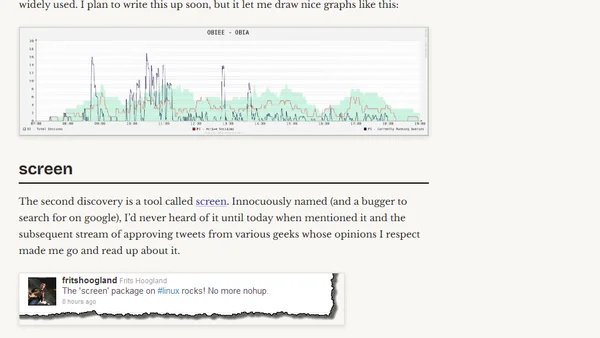
A developer shares their experience learning and using two powerful IT tools: rrdtool for data graphing and screen for terminal multiplexing.
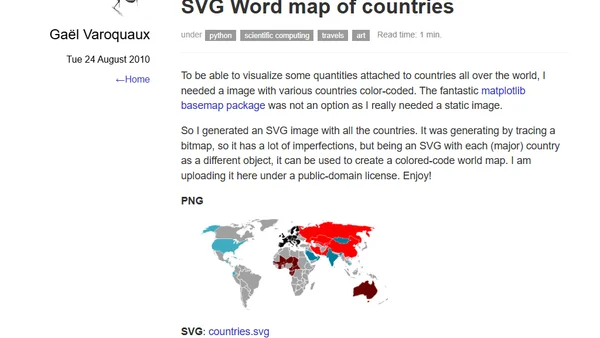
A developer shares a public-domain SVG world map for visualizing country-specific data, created as a static alternative to matplotlib basemap.
Explains two methods in Mayavi to visualize a surface colored by a separate scalar value, not just elevation.
A review of the book 'Matplotlib for Python Developers', covering its content, target audience, and usefulness for scientific plotting.
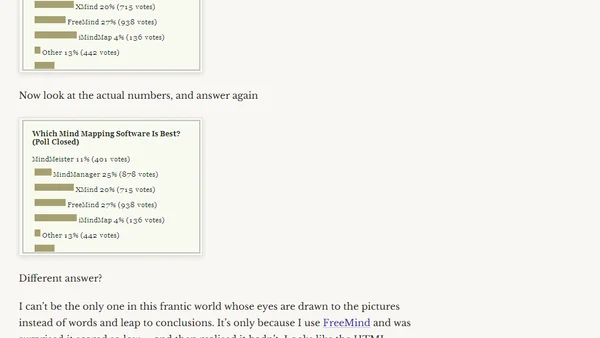
A blog post discussing the power of data visualization, using a mind-mapping software comparison as an example of how visuals can mislead or clarify.