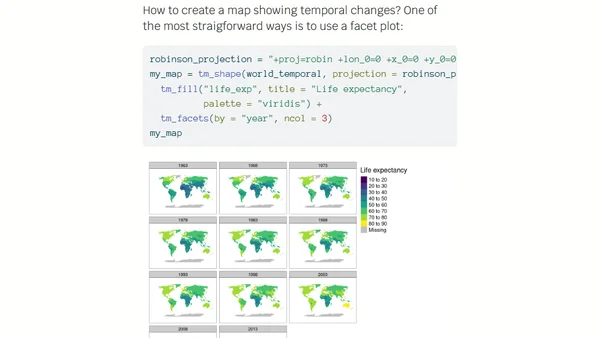
Life (expectancy), animated
Read OriginalThis technical article demonstrates a data analysis workflow in R, using packages like wbstats, dplyr, and ggplot2 to fetch and visualize World Bank socio-economic data. It provides a step-by-step guide to creating time-series plots of life expectancy across multiple countries, focusing on data manipulation and visualization techniques.
Comments
No comments yet
Be the first to share your thoughts!
Browser Extension
Get instant access to AllDevBlogs from your browser
Top of the Week
1
Limit token usage in Microsoft Agent Framework
Jesse Liberty
•
1 votes
2
How to Roll Back AI Agents: Incident Response, Circuit Breakers, and Recovery Patterns
Paul Bryant
•
1 votes
3
Avoiding Reasoning Model Failures with Microsoft Foundry
Luke Murray
•
1 votes
4
When Your AI Agent Lies: Silent LLM Fallbacks
Luke Murray
•
1 votes
5
Adding a custom MCP server to Claude and ChatGPT
Simon Willison
•
1 votes
6
Testing AI prompts and comparing models with promptfoo
Tim Deschryver
•
1 votes
7
Superlogical
Mitchell Hashimoto
•
1 votes